The Reserve Bank of India (RBI) cut the repo rate by 50 basis points in its fourth bi-monthly policy review held on 29 Sep 2015.From opening deep in the red, key equity indices staged a marked recovery on back of an unexpectedly high interest rate cut by the Reserve Bank of India. The Indian equity markets closed 162 points up. An easing of key lending rates is expected to restore investors’ confidence, prop up sales of interest in sensitive sectors like auto-mobile, capital goods and real estate. What are the factors that affect the stock market or atleast the media related to stock market. Every time the event approaches financial media goes into overdrive, will Rate cuts happen? How will fiscal deficit be controlled? The inflation numbers?
Table of Contents
RBI MEETING
- WHY IT IS IMPORTANT: RBI raises or cuts the interest rates,talks about the growth forecast,inflation.
- FREQUENCY: Every 2 months. RBI conducts the Bimonthly meeting overview of which can be found at RBI’s webpage https://rbi.org.in/scripts/Annualpolicy.aspx .
Monetary policy is the process by which monetary authority of a country, generally a central bank controls the supply of money in the economy by its control over interest rates in order to maintain price stability and achieve high economic growth. In India, the central monetary authority is the Reserve Bank of India (RBI)
The key policy or signalling rates include the bank rate, the repo rate, the reverse repo rate, the cash reserve ratio (CRR) and the statutory liquidity ratio (SLR). RBI increases its key policy rates when there is greater volume of money in the economy. In other words, when too much money is chasing the same or lesser quantity of goods and services. Conversely, when there is a liquidity crunch or recession, RBI would lower its key policy rates to inject more money into the economic system.
What is repo rate? Repo rate, or repurchase rate, is the rate at which RBI lends to banks for short periods. This is done by RBI buying government bonds from banks with an agreement to sell them back at a fixed rate. If the RBI wants to make it more expensive for banks to borrow money, it increases the repo rate. Similarly, if it wants to make it cheaper for banks to borrow money, it reduces the repo rate. The current repo rate is 5.50%.
What is reverse repo rate? Reverse repo rate is the rate of interest at which the RBI borrows funds from other banks in the short term. Like the repo, this is done by RBI selling government bonds to banks with the commitment to buy them back at a future date. The banks use the reverse repo facility to deposit their short-term excess funds with the RBI and earn interest on it. RBI can reduce liquidity in the banking system by increasing the rate at which it borrows from banks. Hiking the repo and reverse repo rate ends up reducing the liquidity and pushes up interest rates.
What is Cash Reserve ratio? Cash reserve Ratio (CRR) is the amount of funds that banks have to park with RBI. If RBI decides to increase the cash reserve ratio, the available amount with banks would reduce. The bank increases CRR to impound surplus liquidity. CRR serves two purposes: One, it ensures that a portion of bank deposits are always available to meet withdrawal demand, and secondly, it enables that RBI control liquidity in the system, and thereby, inflation by tying their hands in lending money. The current CRR is 6%.
What is SLR? (Statutory Liquidity Ratio) Apart from keeping a portion of deposits with RBI as cash, banks are also required to maintain a minimum percentage of deposits with them at the end of every business day, in the form of gold, cash, government bonds or other approved securities. This minimum percentage is called Statutory Liquidity Ratio. The current SLR is 25%. In times of high growth, an increase in SLR requirement reduces lendable resources of banks and pushes up interest rates.
What is the bank rate? Unlike other policy rates, the bank rate is purely a signalling rate and most interest rates are delinked from the bank rate. Also, the bank rate is the indicative rate at which RBI lends money to other banks (or financial institutions) The bank rate signals the central bank’s long-term outlook on interest rates. If the bank rate moves up, long-term interest rates also tend to move up, and vice-versa.
Figure below shows how the key policy rates have changed over time.
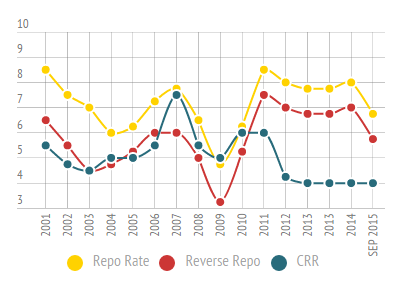
Key rates CRR, Repo rate change over years
FISCAL DEFICIT OF INDIAN GOVT
- WHY IT IS IMPORTANT: Fiscal prudence is becoming a central theme and therefore, investors will punish any emerging countries that not maintaining strict fiscal prudence.
- FREQUENCY: Monthly.
Fiscal deficit/surplus is the difference between the government’s expenditures and its revenues (excluding the money it’s borrowed). A country’s fiscal deficit is usually communicated as a percentage of its gross domestic product (GDP) and is reported by the Ministry of Finance, Government of India. Government Budget is an itemized accounting of the payments received by government (taxes and other fees) and the payments made by government (purchases and transfer payments). A budget deficit occurs when an government spends more money than it takes in. The opposite of a budget deficit is a budget surplus. A sustained and high fiscal deficit reflects poorly on a government’s ability to reduce expenditure and boost revenue
The fiscal deficit in 2015-16 is budgeted at 3.9% of Gross Domestic Product. India recorded a Government Budget deficit equal to 4.5% of the country’s Gross Domestic Product in 2014. . It was 5.08 trillion rupees. For the current financial year ending in March 2015, the government aims to bring the fiscal deficit down to 4.1% of the GDP.Government Budget in India averaged -3.87 percent of GDP from 1991 until 2014, reaching an all time high of -2.04 percent of GDP in 1997 and a record low of -7.80 percent of GDP in 2009.
From http://www.tradingeconomics.com/india/government-budget

India Fiscal Deficit
INDUSTRY WISE DATA
- WHY IT IS IMPORTANT: Several industries like auto, telecom, etc declare their monthly sates figures or subscriber figures. So it is easy for investors to gather some hint about the upcoming quarterly numbers.
- FREQUENCY: Monthly
EXPORT-IMPORT DATA
- WHY IT IS IMPORTANT: Since the Indian rupee is under pressure now, any major change in export/import/ trade balance will impact the rupee.
- FREQUENCY: Monthly.
INDUSTRIAL PRODUCTION
- WHY IT IS IMPORTANT: Industrial production data comes on a monthly basis and therefore, investors can catch the trend change early.
- FREQUENCY: Monthly.
OTHER CENTRAL BANK MEETINGS
- WHY IT IS IMPORTANT: Most of the daily price movements are based on global cues. Entire world waits for the outcome of the next US Federal Reserve meeting to see whether it will increase rates or not. Other central banks to watch out for are the European Central Bank (ECB) and Bank of Japan (BoJ).
- FREQUENCY: While the US Fed meeting takes place every 45 days. ECB and BoJ do monthly meetings.
INFLATION NUMBERS (WPI/CPI)
- WHY IT IS IMPORTANT: Both RBI & Government are focussed on inflation fighting. One should concentrate on CPI inflation because the RBI relies more on CPI to set interest rates. US inflation data is also very important because it may trigger the rate hike fears.
- FREQUENCY: Monthly.
Inflation is an increase in the price of a basket of goods and services that is representative of the economy as a whole. A movie ticket was for a few paise in my parents’ time, few rupees when I was growing up. Now it is more than 200. What you could buy some time ago for Rs.10, after some time(days, year) will be available for more than Rs 10, the worth of money has reduced! This is what inflation is, the price of everything goes up or worth of money reduces. A famous quote on inflation is Inflation is when you pay Rs. 100 for the fifty rupee haircut you used to get for 25 rupees when you had hair.
Our article Understanding Inflation explains Inflation in detail. Based on the goods and services used for calculation there are two kinds of price indices:
- WholeSale Price Index (WPI) : is the index that is used to measure the change in the average price level of goods traded in wholesale market. It includes all the important and price-sensitive goods, which are traded in wholesale markets across the country.
- Consumer Price Index (CPI) : CPI is a statistical time-series measure of a weighted average of prices of a specified set of goods and services purchased by consumers.
India uses both the Wholesale Price Index (WPI) and Consumer Price Index (CPI) to calculate inflation. Most countries(like USA, UK Japan and China) use the Consumer Price Index (CPI) to calculate inflation
F&O CLOSING
- WHY IT IS IMPORTANT: Since the volumes in futures and options market contribute more than 90% of the total volume, price discovery is happening here.
- FREQUENCY: The F&O settlement happens on the last Thursday of every month. If the last Thursday happens to be a market holiday, the settlement happens on the previous trading day.
A future is an agreement between two parties to either buy or sell a security at a later date. The price for the future transaction is agreed upon by the buyer and seller at the time of entering into a contract. An options contract is the right to buy or sell, whereas a futures contract is the promise to actually make a transaction. Futures are called derivatives because they derive their value from the worth of an underlying investment such as an equity.Trading in the derivatives market significantly affects the prices and volatility
QUARTERLY RESULTS
- WHY IT IS IMPORTANT: Though there wilt be short-term volatility due to short-term sentimental factors, long-term share price is linked to the earnings of the company.
- FREQUENCY: Quarterly. The results season usually starts 8 – 10 days after the quarter ends and lasts till 45 days from the quarter end.
- Quarterly result calendar is available at Quarterly results of companies of BSE & NSE websites or sites such as Money control result calendar.
Quarterly results are the window made available to the general public to understand the company’s performance. These are produced in a predefined format that a company must adhere to. According to Securities and Exchange Board of India (Sebi), guidelines it is compulsory for every listed company to produce quarterly results.Quarterly results are early indicators of the company’s progress towards its projected yearly profit targets. Investors should look not only at the net profits figures but also other details like sales growth, debt structure, whether the net profit growth is due to any one time gain and reasons for increase or decrease in expenditure. snapshot of some of the more important parameters that you should look at and what they mean.
- Gross Sales: Gross sales are also called as the ‘top line’ or revenue or total sales. Gross sales are the sum of all sales during a given period.
- Net Sales: From gross sales you can derive net sales by deducting sales return, sales allowances, and sales discount from gross sales.
- Operating expenses: These are expenses that arise during the course of running a business. Operating expense consists of items such as salaries paid to employees, research and development costs, legal fees, accountant fees, bank charges, office supplies, electricity bills, business licenses.
- Operating Profit: When operating expenses are deducted from net sales you get the operating profit, or earnings before interest, tax, depreciation and amortisation (EBITDA).Net Profit or net income: In the income statement you can find details about tax and loan repayment which when deducted from operating profits gives you the net profit. The term net profit or net income is popularly known as ‘bottom line’, which shows the company’s net earnings or losses.
- Outstanding share refers to those shares which are trading in the market. OUTSTANDING SHARES are the number of ordinary shares that, after their issue, have been sold to and are being held by shareholders other than promotors.
- Earning Per Share (EPS): It is the amount of earnings per outstanding share of a company. EPS is arrived at by dividing net profit by numbers of share outstanding.
- HOW EPS WORK?
In simple terms, earnings per share mean (EPS) how much a company is earning in terms of shares that they have floated in the market. For example, if a company makes 20 lakh in profits and have 5000 outstanding shares, the earnings per share would be: 20,00,000 divided by 5,000 = Rs. 400 - P/E RATIO : Price-to-earning ratio or P/E ratio is calculated by dividing current market price of a share by annual earning per share. A high P/E suggests that investors are expecting higher earnings growth in the future compared to companies with a lower P/E ratio. The ratio needs to be compared with peers to find out the relative valuation.
- AMORTISATION: Amortisation means paying off a debt in regular instalments over a period of time or the deduction of capital expenses over a specific period of time (usually over the asset’s life). More specifically, this method measures the consumption of the value of intangible assets, such as a patent or a copyright.
- Interest Cost: It is the cumulative sum of the interest paid on loans by the company.
A single set of numbers will not tell you much. You need to compare it with the prior periods to gauge the direction the company is taking. There are two methods to compare the quarterly performance i.e. quarter-on-quarter (QoQ) or year-on-year (YoY).
QoQ is a comparison of a quarter just prior to the current quarter. For instance a comparison of the quarter ended Sep 2015 with the quarter ended June 2015. This is also known as sequential comparison. However, YoY is the comparison of the quarter with the corresponding quarter a year ago such as comparison of the quarter ended Sep 2015 with the corresponding quarter ended December 2014. Do not take buy or sell decision on the basis of quarterly results only. Investor should check other factors such as policies of the company as the business environment, plans , and other fundamentals of companies
GDP NUMBERS
- WHY IT IS IMPORTANT: Just like individual stocks price movement is linked to the net profit growth of that company, movement of the stock market as a whole can be linked to its GDP growth. In a globalised world, Indian investors should also be worried about GDP growth of other countries, especially the US and China.
- FREQUENCY: Quarterly. While Indian GDP data comes after two months, the US GDP advance estimates come in the last week of the following month.
GDP, or Gross Domestic Product, is the value of all goods and services produced in the economy over a period of time, normally a year. GDP is considered to be yardstick of measuring the functioning of the economy. Our article Understanding GDP of India explains GDP in detail.
An overview of the macro economic data Macro economic data from the planning commission is given below. Click on the image to enlarge
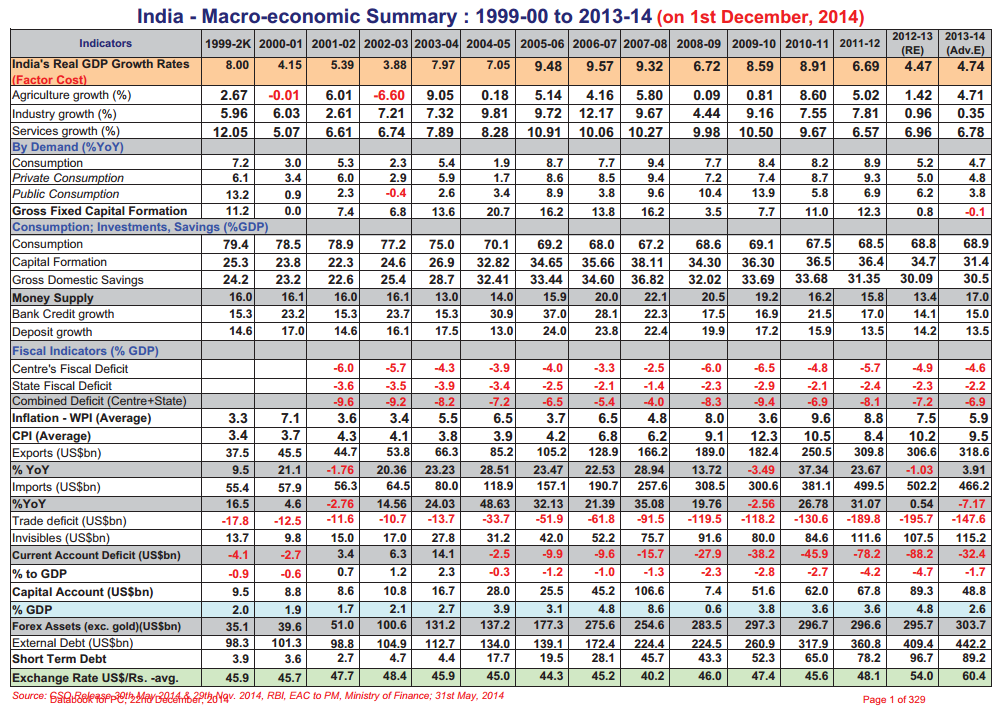
Planning commission macro economic survey
Related Articles:
- News that affect the Stock Market
- Returns of Stock Market, Gold, Real Estate,Fixed Deposit
- Stock Market Index: The Basics
- Fixed Deposits and Tax
- Best and Worst Mutual Funds : Difference in returns
A successful investor is not one who accurately predicts the direction of the markets. Stick to basics, which means you need to ignore the distractions and the desire to give way to your emotions and behave rationally. You should try to find answer to questions: Are there any funds whose volatility is affecting you?Should you drop them from your portfolio. Have you reached your goals? Then it would make sense to move that money out of equity now. Or, is it that you have a better alternative investment in mind? Then you could consider offloading your stocks to finance this investment. Base your decisions on your goals and capability for risk. Not on the volatility of the market. Do you worry about these events


Thanks for sharing such helpful information. Articles like this really help share traders like me who get confused with even a small news affecting online share market. Though I read about the same at my trading portal Myvaluetrade.com news section, but the way you have explained it with the impacts on share market is really impressive.
You said it right, a wise investor is not the one who rightly predicts the market, but the one who can keep patience and control emotions when the market changes due to news like this.
Thanks for sharing wonderful information
DPL Online.