The financial year 2014-15 threw up several surprises for investors. The sustained rally in equities surprised bulls and bears alike while debt investments did fairly well. But assets like real estate and gold, long considered defensive bets, floundered.
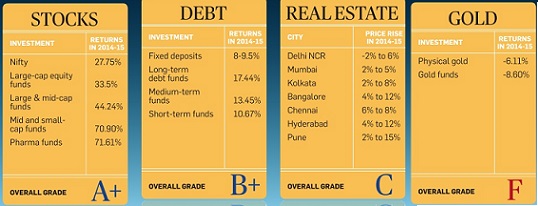
FY 2014-15 for Stocks,Debt,Real estate and Gold
During the fiscal 2014-15,
- Sensex has gone up by 5,571.22 points, or 24.88 per cent to 27,957.49 from 22,386.27 on March 31, 2014. Sensex had touched all-time high of 30,024.74 on March 4 this year.the NSE’s Nifty zoomed by 1,786.80 points, or 26.65 per cent, to settle the fiscal at 8,491 after scaling lifetime high of 9,119.20 on March 4 2015.
- Gold has been on the back-foot for over three consecutive years now vis-a-vis equities after outperforming stock market for more than a decade. Gold prices have come down to Rs. 26,575 per 10 grams from Rs. 29,300 per 10 grams on March 31, 2014. Similarly, silver prices have slid to Rs. 37,200 per kg from Rs. 43,400 per kg.
- Foreign Institutional Investors made a net equity investment of Rs. 1.09 lakh crore in 2014-15, and a further Rs. 1.64 lakh crore into debt markets — Rs. 2.73 lakh crore in all, as per the latest data available with Central Depository Services Ltd (CDSL). This was the highest net inflow by FIIs since being allowed to invest in Indian capital markets (equity and debt) over two decades ago in November 1992. The previous high was in 2012-13, when the net investments climbed to Rs. 1.68 lakh crore.
Here is a report card of various investment classes during the financial year.
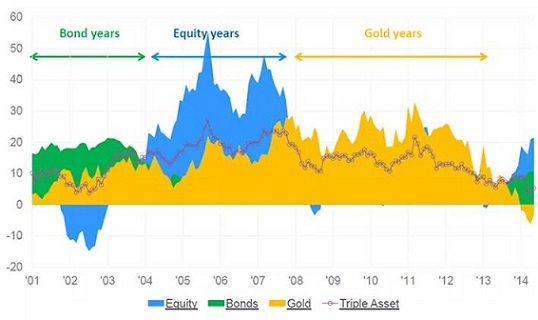
Different asset classes perform at different times
Mutual Funds in FY 2014-15
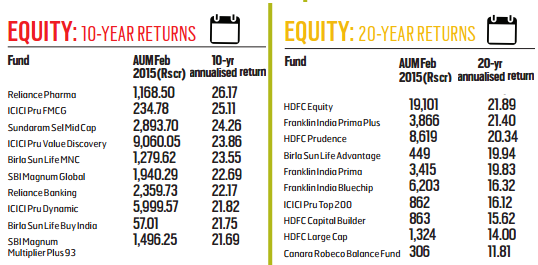
Fifty-one years have passed since the launch of US-64, India’s first mutual fund(it was launched in 1964) Financial year 2014-15 has been good for the Indian markets having posted their biggest gain in the past five years with a return of nearly 25%. Most fund categories made money, thanks to a buoyant equities market and a secular-trending rate cycle. In 2014-15, the country’s 44 fund houses together saw a growth of 31 per cent in their asset base to Rs 11.88 lakh crore at the end of March 31, 2015, according to data released by the Association of Mutual Funds in India (Amfi). The AUM stood at Rs 9.05 lakh crore in preceding fiscal and has been on the rise since 2011-12. In February 2015, the asset base of all the mutual fund companies breached the Rs 12-trillion mark. It took 188 months (or 15.6 years) for the Indian mutual fund (MF) industry to grow from Rs 79,500 crore (in July 1999) to Rs 12.02 lakh crore in February 2015 a gain of 1,412 per cent. It grew over 33 per cent in the last 14 months alone. Mutual fund (MF) industry’s assets base has surged by nearly Rs 3 lakh crore in 2014-15 . To the mutual fund industry’s assets under management (AUM) have barely reached Rs 12 lakh crore even as fixed deposits have almost six times as much, at Rs 70 lakh crore.
But there are two funds that have given nearly four times the index returns in the last one year. Among funds with Assets Under Management (AUM) of nearly Rs 1,000 crore Sundaram SMILE Fund has given investors a return of 105.55% while DSP Black Rock Micro Cap Fund posted a return of 97.83%. In other words both these funds have doubled investors’ money over the last one year.
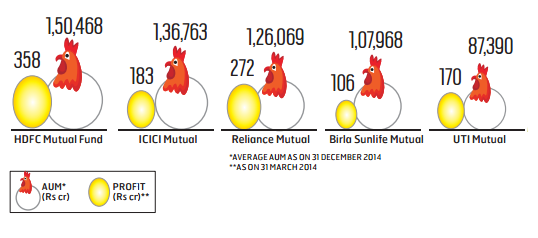
A comparison of AMCs’ net profits for financial years 2013-14 and 2012-13 found that industry profits shot up in excess of 56 per cent over the previous year. The growth in profits is skewed, favouring large fund houses.The 21 profit makers in the industry collected Rs 1,567 crore while the 20 loss makers lost Rs 303 crore. HDFC MF retained its top spot with an AUM , followed by ICICI Prudential MF, Reliance MF , Birla Sun Life MF and UTI MF. Richer AMCs are able to leverage their size and strength to pull even further ahead of the rest, Ref: Expert Take – Story of AMCs: The rich are getting richer
IPO, QIP,OFS
Money raised from equity markets doubled to Rs. 58801 crore in the financial year, the highest since 2009-10, as companies used the buoyancy to mobilise funds mainly under the QIP (qualified institutional placement) route. Fund raising in 2014-15 was substantially through the 55 QIPs which saw Rs.28429 crore being mobilised from institutional investors, up 202% compared to the previous year
There were no big ticket IPOs during the year. Despite a stable government coming into power and the resultant buoyancy in the secondary market, only eight main-board IPOs came to the market collectively raising a Rs.2769 crore in 2014-15. This included only one Rs. 1000 crore plus IPO (Inox Wind-Rs. 1020 crore). The response from the public to the IPOs of the year, was mixed. While three IPOs received good response (Sharda Cropchem at 51 times, followed by Snowman Logistics at 46 times and Wonderla Holidays at 32 times), only three were oversubscribed by more than three times. During the last fiscal, just one IPO, which mobilised Rs. 919 crore, hit the market. The highest-ever mobilisation through IPOs was in 2007-08 when companies raised Rs. 41323 crore. As many as 103 companies, which received approval from market regulator SEBI since April 2009 to collectively raise Rs. 48150 crore, allowed these to lapse, despite approvals being valid for a period of one year. In addition, 58 companies which had filed their offer documents with SEBI since April 2009 to collectively raise Rs. 17685 crore withdrew their offer documents.
Despite a huge target of Rs. 58425 crore of divestment for 2014-15, only Rs. 24338 crore, or just 42% of the target, was achieved. On an overall basis, PSUs (public sector units) contributed 41% of the total equity mobilisation. Offers for sale (OFS) through stock exchanges, one of the major routes used in the last two years, primarily for helping promoters of already-listed companies in complying with the minimum public shareholding requirement, saw a huge increase. Companies raised Rs. 26935 crore through 28 OFS in 2014-15, an almost four-fold increase compared to the previous year. The mega OFS of Coal India, which raised Rs. 22558 crore, propped up mobilisation under the route. Mobilisation of funds through rights issues increased 48% to Rs. 6750 crore in 2014-15
Reference : Times of India Equity fund raising hits five-year high in 2014-15
Related Articles:
- Returns of Stock Market, Gold, Real Estate,Fixed Deposit
- Best and Worst Mutual Funds : Difference in returns
- Ups and Downs of Sensex
- Understanding Returns: Absolute return, CAGR, IRR etc
- Stock Market Index: The Basics
The new fiscal year is expected to see the highest economic output growth in recent years. Oil enters uncharted waters in FY 2016, as the question on everyone’s lips is if it will fall further. The government is planning one issue very month to meet its divestment target of Rs.69,500 crore. A freeing up of foreign investment in insurance is likely to lead to some new listings.Fund houses are upbeat about the industry’s performance for the current fiscal (2015-16) as equity markets are expected to continue their momentum, making the segment attractive. Going forward, however, whether which funds will continue to outperform is anybody’s guess. Gold is expected to stay muted. The MF industry itself has a disclaimer that says past performances are not indicative of future performance of the schemes. How are you planning your investment strategy in FY 2015-16?
