The Income Tax Department , or CBDT has made data on the total number of taxpayers in the country, income disclosed in IT returns by various category of taxpayers and number of PAN holders in the country public for a chosen period of time to encourage wider use and analysis . What was the data released by Income Tax Department, Why was the data released, Overview of data total number of taxpayers in the country, income disclosed in IT returns by various category of taxpayers and number of PAN holders India.
Table of Contents
Overview of the Data released by Income Tax Department
- Under the time series data, between 2000-01 to 2014-15 financial years, discloses the actual direct taxes collection made by the department, direct tax to GDP ratio, the cost of collecting the revenue for the government kitty, number of effective assesses and workload and disposal of IT cases. Income Tax Department Time Series Data Financial Year 2000-01 to 2014-15
- The department has also published statistics filed by taxpayers in their return of income for Assessment year 2012-13. Income Tax Return Statistics Assessment Year 2012-13
- It also discloses the Permanent Account Number (PAN) allocation across various categories and gender by the end of 2013-14 fiscal. Income Tax Department PAN Allotment Statistics Financial Year 2013-14
- Ref: CBDT releases Direct Taxes Data
Why was the Income Tax related data released ?
The Income Tax Department has released Time Series Data for Financial Year 2000-01 to 2014-15 to encourage wider use and analysis. The finance ministry released the data on the request of Thomas Piketty, economist and author of bestseller Capital in the Twenty-First Century. The celebrated economist Piketty had told Business Standard in an interview in January that it was disturbing that there were no public statistics of income tax in India. “These used to be available. There used to be a big publication, the All India Income Tax Statistics, published in this country since Independence till 2000. Then, it was suppressed. For the past 15 years, many people, including myself, have been asking the tax administration to resume publishing this data,” he had said. Ref
After releasing the data, Prime Minister Narendra Modi tweeted: “Our government has taken the landmark decision of publishing the income tax data. It is a big step towards transparency & informed policy making. I am sure this data will be used by researchers & analysts & lead to enhanced insights for policy making on taxation.”
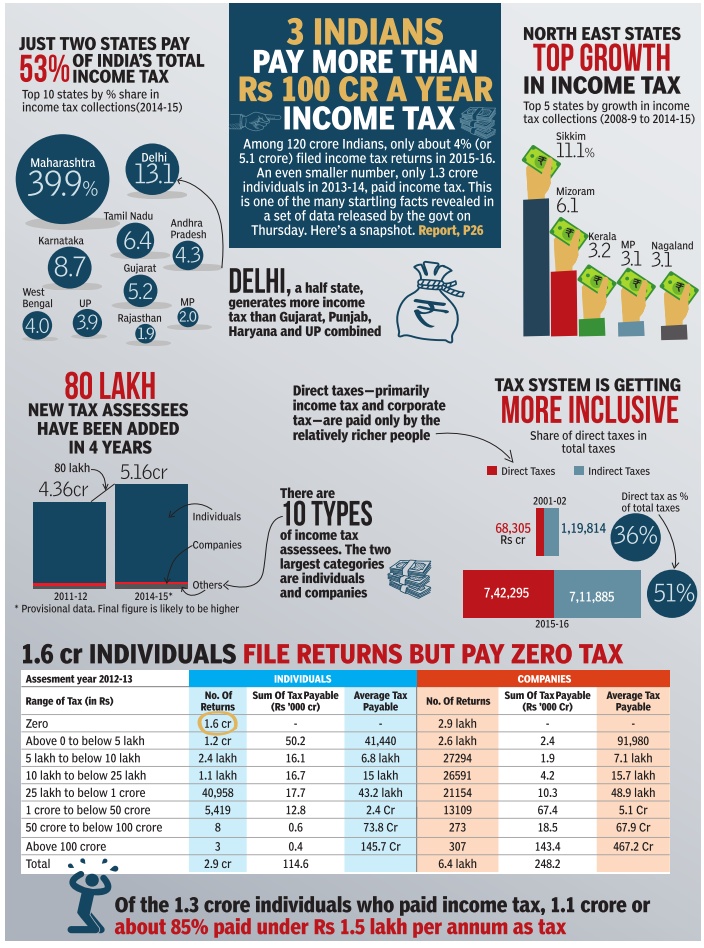
The image below from ,Times of India summarises, the data as infographic.
Overview of Income Tax data released
Income Tax Department Time Series Data Financial Year 2000-01 to 2014-15
Income Tax Department Time Series Data Financial Year 2000-01 to 2014-15 Covers . You can access it at Income Tax Department Time Series Data Financial Year 2000-01 to 2014-15(pdf)
- Direct Tax Collection
- State and U.T. Wise Break-Up of Collection
- Contribution of Direct Taxes to Total Tax Revenue
- Direct-Tax GDP Ratio
- Pre-Assessment and Post-Assessment Collections
- Cost of Collection
- Number of Effective Assessees
- Workload and Disposal of Income tax Cases
Highlights of Income Tax Department Time Series Data Financial Year 2000-01 to 2014-15
- Corporate Tax grew from 35,696 in AY 2000-01 to 4,54,419 in FY 2015-16 (12.73 times)
- Personal Income Tax grew from 31,764 in AY 2000-01 to 2,86,801 in FY 2015-16 (9.03 times)
- State/UT wise Collections : In 2014-15 Maharashtra continued to be the top contributor at Rs 277720.11 crore followed by Delhi at Rs 91,248 crore followed by Karnataka at 60595.22 . Minimum tax collection was from Lakshdweep at 2.84 crore,Arunachal Pradesh at 17.19 crore.
- Direct Tax as % of Total of direct and indirect taxes After the peak of 60% in FY 2009-10, direct taxes in FY 2015-16 dropped 56.16% in FY 2014-15 and 51.05% in FY 2015-16
- Direct Tax as % of GDP Direct Tax as % of GDP remained stable at approx 5.50% since 2011-12
- Pre-Assessment and Post-Assessment Collections : TDS and Advance Tax continued to constitute at about 75% of the total gross tax receipts including self assessment/ regular assessment tax.
- Cost of collection of tax is less than 1% since 2004-05 hovering around 0.6% since 2010-2011.
- Workload and Disposal of Income tax Cases : Total work load disposal ratio for FY 2014-15 was 68.20% in contrast to 71.39% in FY 2011-12. The highest ratio was being achieved in FY 2002-03
- The number of effective assesses has increased to 5.17 crore in assessment year FY15, 4.36 crore in 2011-12. The number is based on income-tax returns plus number of cases where tax has been deducted at source. While number of Individual tax payers top the list being 94.17% (48663680 numbers) in AY 2014-15, they grew by approx 19% as compared to AY 2011-12. However company constitutes only approx 1.38% of the effective taxpayers which is more of less the same as in AY 2011-12.
| PAN Category | AY 2011-12 | AY 2012-13 | AY 2013-14 | AY 2014-15** |
| Association of Person | 110230 | 124010 | 138098 | 142192 |
| Body of Individuals | 5392 | 5688 | 6052 | 6221 |
| Company | 596377 | 654766 | 702621 | 714419 |
| Firm | 950147 | 995648 | 1038309 | 1031457 |
| Government | 62 | 94 | 159 | 294 |
| Hindu Undivided Family | 892205 | 931387 | 956233 | 907047 |
| Artificial Juridical Person | 9896 | 9897 | 10039 | 9649 |
| Local Authority | 5056 | 5459 | 5935 | 6807 |
| Individual | 40883558 | 44346852 | 49033288 | 48663680 |
| Trust | 184563 | 193781 | 202590 | 192056 |
| Total* | 43637486 | 47267582 | 52093324 | ***51 673822 |
* The data is based on the number of income-tax returns entered in the System plus number of cases where tax has been deducted at source from the income of the taxpayer but the taxpayers has not filed the return of income. ** Provisional *** Returns for AY 2014-15 can be filed till 31.03.2016.
Data released Income Tax Department on Income Tax Return Statistics Assessment Year 2012-13
Data released can be accessed at Income Tax Department Income Tax Return Statistics Assessment Year 2012-13. It has 70 page data corresponding to
All Taxpayers,Individuals,HUF,Firms,AOP/BOI and Company. For each category of investor it has data on following
- Range of Salary Income (AY 2012-13)
- Range of House Property Income (AY 2012-13)
- Range of Business Income (AY 2012-13)
- Range of Long Term Capital Gains (AY 2012-13)
- Range of Short Term Capital Gains (AY 2012-13)
- Range of Other Sources Income (AY 2012-13
- Range of Interest Income (AY-2012-13)
- Range of Brought Forward Loss Set off (AY 2012-13)
- Range of Returned Income (AY 2012-13)
- Range of Tax Payable (AY 2012-13)
Highlights of Statistics on Income Tax Return
- The statistics have been generated from e-filed returns (digitally signed or where ITRV has been received) and paper returns captured in system upto 18th December 2014.The statistics relating to sources of income have been prepared on the basis of values mentioned in e-filed returns and values captured from paper returns and the same may contain data entry errors on the part of the taxpayers/ return filers. Therefore, the accuracy of the statistics is limited by the accuracy of returns.
- There are just over 10 lakh income tax assesses in India declaring income in excess of Rs 10 lakh a year
- There were less than 20,000 assesses in 2012-13 declaring income in excess of a Rs 1 crore a year.
- The Super Rich, the Rs. 1 crore club consisted of just 0.06 percent of the tax payers.
- The three individuals in the top-bracket of Rs. 100-500 crore paid a total tax of Rs. 437 crore — resulting in an average tax outgo of Rs. 145.80 crore.
- 62% or nearly 2 crore of the 3.11 crore return filers of 2011-12 fiscal, did not indicate any salary earnings, instead they had other sources of income from businesses, house property, interests, short term and long term capital gains tax, etc.
- Amongst the salaried class, a huge chunk of returns (nearly 20 lakh) were filed by those who earned between Rs. 5.5 lakh and Rs. 9.5 lakh.
- Those earning between Rs. 2.5 lakh and Rs 3.5 lakh per annum followed as the second largest filers of return in 2011-12.
- 11 lakh professionals, including chartered accountants, auditors, fashion designers, lawyers and medical service practitioners, paid direct taxes in 2011-12.
Data released by Income Tax Department on PAN Allotment Statistics
It also discloses the Permanent Account Number (PAN) allocation across various categories and gender by the end of 2013-14 fiscal. Income Tax Department PAN Allotment Statistics Financial Year 2013-14
| Taxpayer Status | PAN Allotted During FY 201 3-14 | Percentage |
| ASSOCIATION OF PERSONS | 70,970 | 0.25% |
| BODY OF INDIVIDUALS | 4,306 | 0.02% |
| COMPANY | 1,01,973 | 0.36% |
| FIRM | 2,43,789 | 0.86% |
| GOVERNMENT | 876 | 0.00% |
| HUF | 70,196 | 0.25% |
| ARTIFICIAL JURIDICAL PERSON | 1,444 | 0.01% |
| LOCAL AUTHORITY | 4,333 | 0.02% |
| INDIVIDUAL | 2,76,45,257 | 98.07% |
| TRUST | 46,308 | 0.16% |
| TOTAL | 2,81,89,452 | 100.00% |
Notes:
- “Taxpayer Status” means the status of the taxpayer as per PAN database of Income Tax
- “Percentage” means percentage of number of PAN allotted for a given status with respect to total number of PAN allotted.
PAN Allotment – Gender and Age of Individual
| Gender | Age bracket | PAN Allotted During FY 2013-14 | Percentage |
| Male | =<18 years | 9,20,833 | 3.33% |
| Male | >18 and <= 20 years | 22,80,875 | 8.25% |
| Male | >20 and <= 30 years | 70,41,241 | 25.47% |
| Male | >30 and <= 40 years | 35,74,978 | 12.93% |
| Male | >40 and <= 50 years | 23,41,942 | 8.47% |
| Male | >50 and <= 60 years | 12,62,814 | 4.57% |
| Male | >60 and <= 70 years | 6,04,535 | 2.19% |
| Male | >70 and <= 80 years | 2,41,194 | 0.87% |
| Male | >=80years | 44,956 | 0.16% |
| Total Male | 183,13,368 | 66.24% | |
| Female | =<18 years | 3,15,776 | 1.14% |
| Female | >18 and <= 20 years | 6,89,841 | 2.50% |
| Female | >20 and <= 30 years | 31,57,359 | 11.42% |
| Female | >30 and <= 40 years | 21,73,555 | 7.86% |
| Female | >40 and <= 50 years | 14,93,898 | 5.40% |
| Female | >50 and <= 60 years | 8,68,792 | 3.14% |
| Female | >60 and <= 70 years | 4,54,884 | 1.65% |
| Female | >70 and <= 80 years | 1,43,797 | 0.52% |
| Female | >=80years | 33,987 | 0.12% |
| Total Female | 93,31,889 | 33.76% | |
| Total | 2,76,45,257 | 100.00% |
Notes:
- “Individual” means the persons in the PAN database of Income Tax Department whose status is ‘Individual’ as per the PAN database.
- The age of the individual is taken as on 31st March 2013.
- “Percentage” means percentage of number of PAN allotted for a given Gender and Age Bracket with respect to total number of PAN allotted for Individuals.
Related Articles:
- What is PAN Card ?
- Changing Name:What to do?
- Transactions reported to Income Tax Department
- Aadhaar : What is Aadhaar, How to enrol,Check Aadhaar status,Download e Aadhaar
- When you loose your wallet,Credit Card, PAN Card, Driving License
- Income Tax for FY 2015-16 AY 2016-17
Do you think such data should be out for public? Were you surprised or shocked by the data?


Nice information
Nice information