We make investments to earn returns. But there are different ways of calculating returns such as absolute return, simple annualised return, CAGR, XIRR, Rolling Returns. For example, simple point-to-point return(absolute returns) is preferred when the holding period is less than one year and CAGR is ideal for longer holding periods In this article, we shall see different ways to compare returns.
Table of Contents
How to calculate Returns?
Return is the gain or loss in the value of an asset in a particular period. It is usually quoted as a percentage. We can define Investment return is the change in value of an investment over a given period of time. For example
Rohan invested Rs 10,000 in a mutual fund and 2 years of holding it became Rs 20,000
Aryan invested Rs 50,000 in Gold for 7 years and it became Rs 4,00,000
But Who earned more? How to calculate returns so that we do not end up comparing apple to oranges!
The general rule is that the more risk you take, the greater the potential for higher return – and loss. Return on investment has two basic components.
- Interest and/or dividends, the income generated by the underlying investment.
- Appreciation(Depreciation), an increase(decrease) in the value of the investment.
Why finding a return on investment is important:
- Determining return on investment is an important part of investment review to know whether your investments are on track and make appropriate adjustments.
- Estimating a return on investment also helps in choosing among investment options – Should one invest in Gold/Real Estate/Stocks/Mutual Funds/Fixed Deposits ?
Let’s learn about various kind of returns!
Absolute return or Point to Point Returns
Absolute return is the increase or decrease that an investment achieves over a given period of time expressed in percentage terms. It’s calculated as follows:
Absolute returns = 100* (Selling Price – Cost Price)/ (Cost Price)
For example you invested in asset in January 2005 at a price of Rs 12000. And you sold the investment in January 2012 at the cost of Rs 3200. Absolute returns in this case will be:
Absolute returns = 100* (32000 – 12000)/12000
= 100 * 20000/12000
= 166.67%
This measurement of return is the simplest and it does not consider the time period. Most times it produces a large number so people are impressed!
Simple Annualized Return: The increase in the value of an investment, expressed as a percentage per year. expressed as
Simple Annualized Return= Absolute Returns/Time period.
Suppose investment of Rs 1,00,000 becomes 1,24,000 over three years.
Absolute return = 100* ( 12400 – 100000/100000 ) =24 %.
Simple annualized return = 24/3 = 8 %
Average Annual Return (AAR)
Average annual return (AAR) is the arithmetic mean of a series of rates of return. The formula for AAR is:
AAR = (Return in Period 1 + Return in Period 2 + Return in Period 3 + …Return in Period N) / Number of Periods or N
Let’s look at an example. Assume that an investment XYZ records the following annual returns:
| Year | Annual Return |
| 2005 | 20% |
| 2006 | 25% |
| 2007 | 22% |
| 2008 | -10% |
AAR for the period from 2005 to 2008: = (20% + 25% + 22% -10%) / 4 = 57%/4 = 14.25%
AAR is somewhat useful for determining trends. However, because returns compound (they generally not add) AAR is typically not regarded as a correct form of return measurement and thus it is not a common formula for analysis. In addition, one or a few particularly high or low data points (“outliers”) can skew the average and provide misleading results. ( Ref: InvestingAnswers : Definition of AAR)
What is CAGR (Compound Annual Growth Rate)
CAGR is the year-over-year growth rate of an investment over a specified period of time. It’s an imaginary number that describes the rate at which an investment would have grown if it grew at a steady rate.
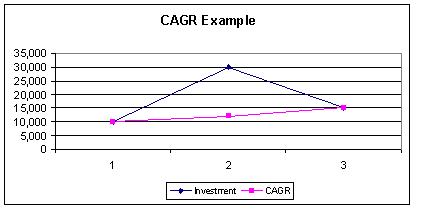
Let’s assume you invested Rs 10,000 in Apr 2019 and by Apr 2020 your investment became Rs 30,000, by Apr 2022 it became Rs 15,000. What was the return on your investment for the period?
| Description | Profit/Loss(in the period) | Initial Amount for the period | Profit/Loss Percentage(in the period) |
| Return in year 2019-20 | 20,000 | 10,000 | 100*( 20,000/10,000) = 200% |
| Return in year 2020-21 | -15,000 | 30,000 | 100 *(-15,000/30,000) = -50% |
| Absolute Returns from Apr 2019-21 | 15,000-10,000 =5000 | 10,000 | 100*(5,000/10,000) = 50% |
| Simple Annualized Return from Apr 2019-21 | 5000 in 2 years | 10,000 | 100*(5000/10,000 * 2)= 25% |
CAGR is a way to smoothen out the returns, it determines an annual growth rate on an investment whose value has fluctuated from one period to the next as shown in picture below. In that sense CAGR isn’t the actual return in reality. This is similar to saying that you went on a trip and averaged 60 km/hr. Whole time you did not actually travel 60 km/hr Sometimes you were traveling slower, other times faster.
The formula to calculate CAGR is :
So CAGR for above example is :
= ((15,000/10,000) ^ (1/2)) -1
= 22.47%
If the investment states that it had an 8% annualized return over ten years, that means if you invested on Apr 1, and sold your investment on Mar 31 exactly ten years later, you earned the equivalent of 8% a year. However, during those ten years, one year the investment may have gone up 20% and another year it may have gone down 10%. In the example if the investment Rs 10,000 would have grown at the rate of 22.47% every year and at end of two years it would be Rs 15,000 as shown in calculation below.
| Year | Initial Value | Growth | Final Value |
| 1 | 10,000 | 2,247 | 12,247 |
| 2 | 12,247 | 2752 | 15,000 |
Good and Bad of CAGR: CAGR is the best formula for evaluating how different investments have performed over time. Investors can compare the CAGR in order to evaluate how well one stock/mutual fund has performed against other stocks in a peer group or against a market index. The CAGR can also be used to compare the historical returns of stocks to bonds or a savings account. But the bad points of CAGR are:
- CAGR does not reflect investment risk, and you must use the same time periods.
- CAGR does not reflect volatility. Investment returns are volatile, they can vary significantly from one year to another. CAGR give the illusion that there is a steady growth rate even when the value of the underlying investment can vary significantly.
For example ,investment in XYX had the following price trend over three years:
| Year | Price |
| 0 | 5,000 |
| 1 | 22,000 |
| 2 | 5,000 |
This could be viewed as a great investment if you were smart enough to buy at 5,000 and one year later sell it at 22,000 for a 340% gain. But if one more year later the price was 5 ,000 and you still have it in you would be even. If you bought XYZ in year 1 at 22,000 and still had it in Year 2, you would have lost 77% of your value (from 22,000 to 5,000). Ads can tout a fund’s 20% CAGR in bold type, but the time period used may be from the peak of the last bubble, which has no bearing on the most recent performance. More Details about CAGR at Investopedia: Compound Annual Growth Rate: What You Should Know
What are Rolling Returns?
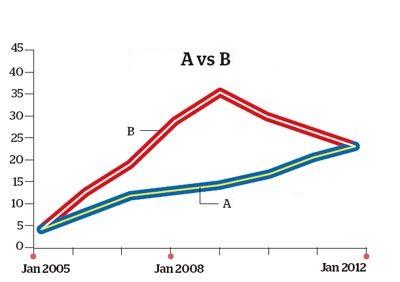
Returns that we have looked at so far have used the value of investment at beginning and at end of the period. But does that tell the full story. Suppose there two investments, A and B, both purchased for 12 and both sold seven years later for 32 as shown in figure below.
- Point-to-point returns : Both have generated an absolute return of 100* (32-12)/32 =166.67%.
- CAGR :CAGR calculation would also yield identical results, that is, 10.41%
What’s different between the two funds is the consistency of their respective performance-A is consistently rising whereas B, after showing a robust growth for the first four years, declines consistently after 2009. Clearly, A is a better choice, which you’d never know by relying on the point-to-point/CAGR return measures. Ref EconomicTimes:How to calculate returns from a mutual fund
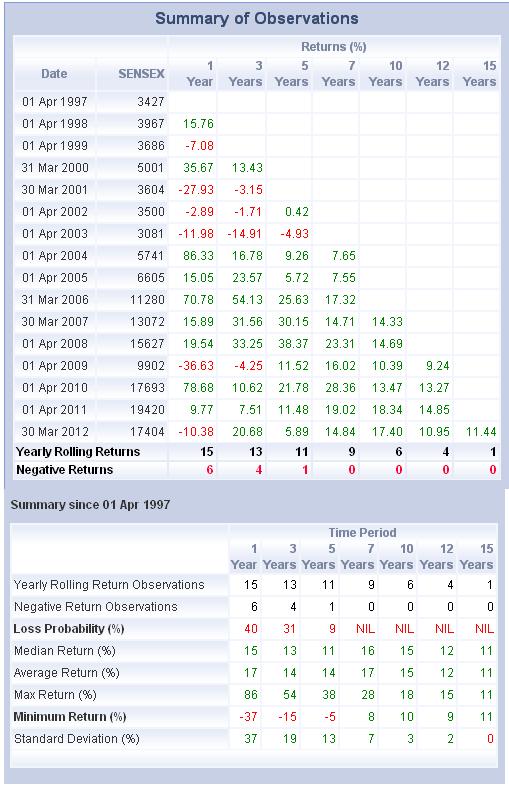
Rolling returns paint quite a different picture in this example. Rather than a single return spanning the entire time frame, rolling returns divide the period into equal but smaller periods. The rolling return is the average of the smaller period returns. For example, consider rolling 12-month periods over the same five years. To get this, you’d start by calculating the single point return over the first twelve months. Next, you’d calculate the single point return for months 2-13. You’d continue the process by adding the next month and dropping the oldest month until you had single point results for all 12-month periods in the seven years. The average of these results is the rolling 12-month return. HDFCFund:Sensex rolling return calculator can calculate rolling returns of Sensex from any date between 03 Apr 1979 to 30 Aug 2011. Using the calculator Rolling returns from 1st Apr 1997 are as shown in picture below:
But rolling period statistics have their limitations, too. By their very nature, they tend to put more weight on returns in the middle of the measurement period and less on those at either end. The KleinPost: Rolling Returns vs Fixed Period Returns has more details.
Video on Rolling Returns
What are Rolling Returns?explained in this video
BenchMark
Mr Sharma earned 12% returns in mutual fund. Is it good or bad? It’s like saying a child has got 92% in exams? Questions asked is compared to what? If Mr Sharma’s mutual fund gave 12% when Nifty gave a return of 15%! 12% is not so good but if Mr Sharma’s mutual fund gave 12% when Nifty gave 7% then 12% is good. When evaluating the performance of any investment, it’s important to compare it against an appropriate benchmark. A benchmark is usually an index of the same or similar class against which the performance of a stock, bond, mutual fund can be measured. For example, bond yields are generally compared to benchmark yields on Government securities of similar maturity. Stocks, Mutual fund performance is often compared to Sensex or Nifty . Comparing a portfolio to an inappropriate benchmark could yield misleading information. For example, the BSE 200 may be an appropriate benchmark for a portfolio investing exclusively in large and mid-cap domestic stocks, but it may be inappropriate for a portfolio investing in bonds or only large cap fund . Benchmarking lies at the heart of the controversy between passive and active management trying to answer the question “What value was added by the manager’s decisions”. Benchmark helps to answer question Should I invest in HDFC Top 200 Fund or Exchange Traded Fund based on Nifty?
Relative Return
Relative returns enable us to know the true return earned by the fund over and above the benchmark.It determines how the return of a given stock or fund compares to that of benchmark. This can be useful in making investment decisions.For example, if the stock you are holding achieves a return of 20 per cent, while the benchmark index say Nifty managed 15.58 per cent, then the stock has achieved a relative return of a +4.42 per cent. A stock that falls less than the benchmark in a falling market is considered to have done well, as it manages to contain losses for the investor.
Peer Returns
Suppose you invest in State Bank of India(SBI) and the stock increases in a year by 7%. Other banking stocks rise like HDFC Bank by 9% ICICI Bank by 6.5%, Punjab National Bank (PNB) by 5% and Banking Index by 6%. It means SBI has given better returns as compared to Banking Index and among its peers better than PNB but less than HDFC Bank and ICICI bank. Peer return helps in selection of investment within a particular sector or sub-group of an asset class such as banking stock in above example.
Risk Adjusted Returns
Is performance just a matter of high returns, or should you also be concerned about risk? For example, two investment options have the same 7% annual return. One is 100% invested in Govt. Bonds, and the other is 100% invested in mid-capitalization stocks. With the Govt bonds, there is very little volatility in returns. while with the mid-capitalization investment, there is extreme volatility. Risk matters and the Risk-adjusted return measures how much risk is involved in producing that return. It is generally expressed as a number or rating. The concept is very popular while comparing the returns from equity mutual fund schemes. There are five principal risk measures: alpha, beta, r-squared, standard deviation and the Sharpe ratio. Each risk measure is unique in how it measures risk. Quoting from Investopedia : 5 Ways To Measure Mutual Fund Risk
- Alpha: It takes the volatility (price risk) of a security or fund portfolio and compares its risk-adjusted performance to a benchmark index. The excess return of the investment relative to the return of the benchmark index is its alpha. A positive alpha of 1.0 means the fund has outperformed its benchmark index by 1%. Correspondingly, a similar negative alpha would indicate an underperformance of 1%. For investors, the more positive an alpha is, the better it is.
- Beta: Beta is calculated using regression analysis, and you can think of beta as the tendency of a security’s returns to respond to swings in the market. A beta of 1 indicates that the security’s price will move with the market. A beta of less than 1 means that the security will be less volatile than the market. A beta of greater than 1 indicates that the security’s price will be more volatile than the market. For example, if a fund portfolio’s beta is 1.2, it’s theoretically 20% more volatile than the market.
- R-Squared: R-Squared is a statistical measure that represents the percentage of a fund portfolio’s or security’s movements that can be explained by movements in a benchmark index. R-squared values range from 0 to 100.Mutual fund investors should avoid actively managed funds with high R-squared ratios, which are generally criticized by analysts as being “closet” index funds. According to Morningstar, a mutual fund with an R-squared value between 85 and 100 has a performance record that is closely correlated to the index. In these cases, why pay the higher fees for so-called professional management when you can get the same or better results from an index fund?
- Standard Deviation: Standard deviation measures the dispersion of data from its mean i.e the more that data is spread apart, the higher the difference is from the norm. In finance, standard deviation is applied to the annual rate of return of an investment to measure its volatility (risk). A volatile stock would have a high standard deviation. With mutual funds, the standard deviation tells us how much the return on a fund is deviating from the expected returns based on its historical performance.
- Sharpe Ratio :The Sharpe ratio tells investors whether an investment’s returns are due to smart investment decisions or the result of excess risk. It is calculated by subtracting the risk-free rate of return (Treasury Bond) from the rate of return for an investment and dividing the result by the investment’s standard deviation of its return. It was developed by Nobel laureate economist William Sharpe. This measurement is very useful because although one portfolio or security can reap higher returns than its peers, it is only a good investment if those higher returns do not come with too much additional risk. The greater an investment’s Sharpe ratio, the better its risk-adjusted performance.
So far we focused on investing only one time – we had beginning value and end value. But How do you calculate your returns when you every year/period you invest different amount and at the end you receive your Money back or you get some dividend ?
Internal rate of Return(IRR) and Extended Internal Rate of Return (XIRR)
Suppose your invest 5,000 , 10,000, 6,000, 4,000 and 6,500 in 5 yrs and Get 53,000 at the end of 5 yrs , what is your Return ? Or you invested Rs 10,000 in the stock which gave 10% annual dividends. At end of 5 years you sell stock for 12,000 Rs. The return that is used in such cases is IRR or Internal Rate of Return. Its used to calculate the returns given some amount at a fixed interval . For example after every 3 months or after every 1 yr . The only thing which matters is that there should be equal distance between two installments. When you invest you need to -ve as in example beginning we invested Rs 10,000 which is written as -10,000. While when we get something out of investment like dividend we need to show it as positive quantity. IRR for investment in stock comes out to be 13.08% as shown in the picture below.
| Year | Amount |
| 0 | -10,000 |
| 1 | 1,000 |
| 2 | 1,000 |
| 3 | 1,000 |
| 4 | 1,000 |
| 5 | 1,000+12,000 |
| IRR | 13.08% |
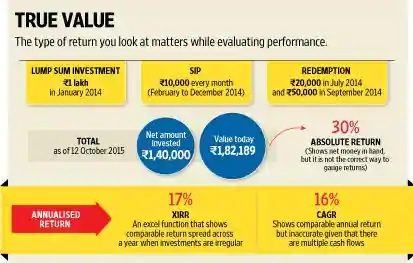
But what when the payments are at Irregular interval, in that case, we use Extended Internal Rate of Return or XIRR . Excel Function IRR and XIRR are used for calculating.
Video on Calculating Returns in Mutual Funds
This video explains various types of returns in Mutual Funds
Note: The article is for educational and informational use and do not construe this as professional financial advice. Check out our Disclaimer.
Related Articles:
Bemoneyaware covers EPF, UAN, Investing, Women, Debt, Big Boss & More
- Time Value of Money
- All About Investing in India:PPF,Fixed Deposits, Mutual Funds, NPS, Stocks
- Finding Info on NFOs of FMP,MFs,FD and Saving Interest Rates
- Online Frauds : UPI Scam, AnyDesk, Matrimonial Site, Lottery, Fake Job Offer etc
Investment returns over a particular period of time can be stated as absolute return Or, they might be stated as an annualised return . For multiple investments over period of time one needs to use IRR or XIRR. For Investors should understand how investment returns are calculated and which return to consider for making investment decisions. Awareness about calculating the returns from investment is essential to be a smart investor. Which return do you use for reviewing or choosing investments?





The best description and explanations I have ever read. Kudos to the author.
Question: What’s the correct method analysing Swing Trade Portfolio as a whole and individual stocks in swing trade ie. while they are invested.
Very well explained. I was tracking my Mutual fund investment for Abs Ratio
This is great article. I am managing a excel with my funds investment details. I started many funds with lump sum payment then SIP (mostly for a year). I initiate SIP every year & have increased SIP amount in some cases. Those SIPs continuing for few years now.
I have put CAGR to calculate fund’s performance (combing SIP + Lump sum) but not sure if CAGR would provide most accurate performance in my case explained above. It will be daunting task if I have to put XIRR or IRR against SIPs. What shall I do?
Secondly, how do I interpret CAGR return shown across AMC? Example: My dad invested Rs5900 (lumsum) in one of gift fund 13yrs ago. Current valuation is at 20K. Today CAGAR shows 9.7% while absolute return 240% (18% per year?). Is there any criteria to consider CAGAR return good or bad over the years? Does it make sense to consider only absolute return?
Such a great and detailed article I have ever seen. I also have an article about CAGR in my blog here is the link of it. https://www.siptolumpsum.net/2018/12/cagr-meaning-in-hindi-compounded-annual-growth-rate.html Kindly Check it also.
I’ve never seen such a great explanation……!!!! Totally unbiased… Nothing intentional… Every other blog has only intentions to pull in our money.. this one is really great and very informative… Thanks a lot author….!!!
The hallmark of this blog is the simplicity it uses to explain the various concepts.Great work.Keep it up.
I want to ask how do i calculate real estate returns considering i have taken a loan and rented it out.Please help in finding out the roi
Thanks for nice guidance explaining Mutual Fund related terminology and their meaning with example
first time, i could learn terminology and its meaning given in article on Mutual Funds returns,though i have made good investment in MF.
Thanks
Hey buddy, thanks for this great article. How would one calculate sip returns. If I invest 5000 for 15 years with xirr 13% what would be my final corpus? How do I calculate this? Is there a calculator or formulae?
Thanks much.
Vaibhav
Please Read the statement as below
JUST BY LOOKING AT STARS (RATINGS) FROM SOME WEBSITES??????
I am a fan of your articles, this one in particular.
I have many a questions related to MF Investing and Stocks Investing.
Relared to MF :
How do we select best Liquid Funds to park your money for Shorter Terms and How do you do it for Long Term Equity Funds – JUST BY LOOKING AT STARTS FROM SOME WEBSITES??????
Related to Stocks :
Any idea on what parameters one should gauge to analyze a stock Fundamentally and find out the Multibbagers???
Thanks in Anticipation,
Sunil Ramidi.
Thanks Sunil for your kind words.
Answer to your questions:
Liquid funds can be a good alternative to savings bank account to park one’s emergency fund. Low cost structure, better returns, high liquidity and reasonable safety make liquid schemes attractive to investors, especially over a short-term horizon. It is a common practice of corporate houses and high net worth individuals to park their surplus money in liquid funds. However, retail investors have not shown much interest in this option.
Selecting fund based on star ratings is like saying Salman Khan every movie is a hit. This was said sometime back for Akshay Kumar. What you need to find are long lasting actors..someone like Aamir Khan.
Ratings keep on going up and down but if you can find one which is in top 25 percentile or have consistent rating that should be okay. Factors such as the fund house and the scheme vintage, overall assets under management (AUM) of the mutual fund, consistent performance over a longer period and comparison of the scheme with appropriate benchmarks can be looked at for selecting the right fun
Stocks:
If I had known I would have made money 🙂
There are different ways suggested by different investors. Some look for PE, Some go for contarian buying, depends on what you want. You need to do your own research. There are many experts out there who could give you helpful advice, but there are also many people out there who think they are experts, and their advice may not be as solid. So, if a friend gives you a tip and urges you to buy because such and such a company is hot, make sure to not blindly follow their advice.
Thanks a lot for your answer.
Thanks Sunil for acknowledging. Looking forward to more questions!
So what type of return does MF use when they state returns in their fund card or popular websites?
A very good question and we have updated our article to answer it.
Typically a simple point-to-point return is preferred when the holding period is less than one year and CAGR is used for longer holding periods.