Would you pay a million rupee pay for a bunch of tulips, the flowers? There have been numerous occasions in history all over the world when things like tulips, land or website stocks were sold at significantly more than their cost. In every one of these cases, costs rose exponentially and suddenly weakened. These are called bubbles and like actual soap bubbles, they soon burst. Even a great scientist like Issac Newton was caught up in the South Sea Bubble and lost money. Let’s look at some Example of bubbles like Tulip Mania in 1636, South Sea in 1720, Japan real estate and the stock price of the 1990s, Dot Com bubble of 2000, Subprime crisis of 2008. Can one identify a bubble? Then maybe we can answer Is the current stock market run a bubble? Is bitcoin or cryptocurrency a bubble?
I can calculate the motion of heavenly bodies, but not the madness of people. – Issac Newton
Table of Contents
What is an Economic bubble? Examples of Bubbles
A bubble occurs when the price of a financial asset or commodity, housing, stocks, or gold dramatically rise in price over a short period that is not supported by the value of the product. The hallmark of a bubble is irrational exuberance—a phenomenon when everyone is buying up a particular asset. Bubbles are harder to detect, and may only be identified in hindsight.
- Tulip Mania in the Netherlands in 1636-37: During the Dutch Tulip Bubble, tulip prices soared twenty times between November 1636 and February 1637 before plunging 99% by May 1637.
- South Sea Bubble of 1720 in London: shares of the South Sea company surged more than eight times in 1720, from £128 in January to £1050 in June, before collapsing in subsequent months and causing a severe economic crisis
- Japanese stocks and urban land values tripled between 1985-1989. The bubble burst in 1991, causing price deflation and stagnant economic growth in Japan known as the Lost Decade.
- Dotcom bubble of 2000 in US: US NASDAQ Composite Index, which is the index of technology/dot-com company stocks, soared from a level of under 500 at the beginning of 1990 to a peak of over 5,000 in March 2000. The index then crashed going down nearly 80% by October 2002 and triggering a U.S. recession
- Subprime mortgage crisis & Lehman Brother Crisis of 2008: The United States subprime mortgage crisis occurred in the US between 2007 and 2010 and contributed to the U.S. financial crisis. It was triggered by a large decline in home prices after the collapse of a housing bubble, leading to mortgage delinquencies, foreclosures, and the devaluation of housing-related securities.
Bubbles can be damaging to the wider economy, especially if it is a key market, such as housing or the stock market. If house prices fall rapidly, it will cause a significant fall in consumer spending and can cause a recession, for example, the real estate crash of 1991 contributed to the Japan recession.
Stages of an economic bubble
According to the economist Charles P. Kindleberger, The basic structure of a speculative bubble can be divided into 5 phases:
- Substitution: increase in the value of an asset
- Takeoff: speculative purchases (buy now to sell in the future at a higher price and obtain a profit)
- Exuberance: a state of unsustainable euphoria.
- Critical stage: begin to shorten the buyers, some begin to sell.
- Pop (crash): prices plummet
Although every bubble is different, one common element in most bubbles is the willingness of participants to suspend disbelief and to steadfastly ignore the increasing number of cautionary signs. Another is that the bigger the bubble, the greater the damage it inflicts when it bursts. And perhaps most important is that the five biggest historic bubbles, along with others along the way, hold valuable lessons that should be heeded by all investors.
Video on Economic Bubbles
Economic bubbles often lead investors to pay sky-high prices for hyped assets, ranging from tulips to real estate. So what is a bubble and when does it pop? CNBC’s Elizabeth Schulze explains from the Netherlands, home to one of history’s best-known bubble bursts.
Dutch Tulip Bubble
Tulip Mania is often cited as the classic example of a financial bubble. When the price of something goes up and up, not because of its intrinsic value, but because people who buy it expect to be able to sell it again at a profit.
In 1636, the entire Dutch society went crazy over exotic tulips. As prices rose, people got swept up in a speculative fever, spending a year’s salary on rare bulbs in hopes of reselling them for a profit. Details of Tulipmania were captured in the book Memoirs of Extraordinary Popular Delusions and the Madness of Crowds written in 1841 by Charles MacKay,
By the 1630s, Netherlands was rich due to Dutch East Indian company which traded in spices from Asia. This led to many showing off their wealth by living in huge houses with blooming gardens.
Tulips were especially sought after as
- Tulips were viewed as an extraordinary bloom as they were imported from the East in vessels
- Tulips were hard to develop as it could take a very long time for it to bloom.
- Especially the Tulip flowers with streaks which were due to Tulip Breaking Virus. These select tulips were more difficult to find than typical tulips. And so rose the costs of these blossoms
Soon tulips turned into the national sensation. Tulip costs kept on rising and it became insanely high. Then many acknowledged that costs of tulips far surpassed their genuine worth. And this pulled the cost down and the bubble burst,
The “ripple effect” from the tulip crash sent the Dutch economy into a depressionary tailspin from which it took years to recover.
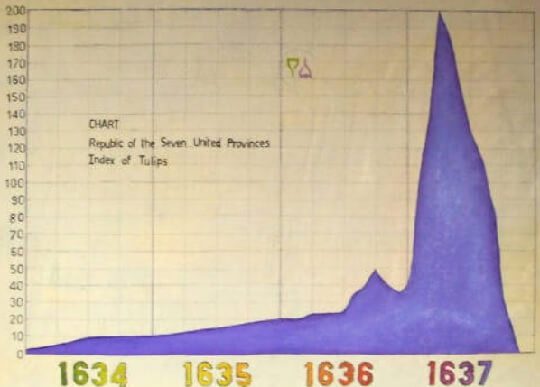
How cost of tulip moved up and down
South Sea Bubble and Issac Newton
The South Sea Bubble of 1720 was a major financial crash in London. It immediately followed a similar crash on the Paris stock market, known as the Mississippi Bubble. South Sea Company began 9 years earlier, in 1711, by an act of the English Parliament, mainly to help the British government with its war debt.
Due to the War of the Spanish Succession (1702–1713), the British government was in arrears with its payments to naval contractors for supplies. South Sea shares were given to naval contractors in lieu of cash payments. To generate income, in 1713 the company was granted a monopoly (the Asiento de Negros) to supply African slaves to the islands in the “South Seas” and South America.
The South Sea company also underwrote the English National Debt, which stood at £30 million, on a promise of 5% interest from the Government, technically called debt-for-equity swaps.
The company never realised any significant profit from its monopoly. However, Company stock rose greatly in value as it expanded its operations dealing in government debt, and peaked in 1720 before suddenly collapsing to little above its original price.
Isaac Newton was one of the many who lost their entire fortunes in the South Sea bubble. He invested early, sold high, and made a good return on his money. But he also suffered from FOMO as he watched his friends continue to invest and make even more money. So, he bought back all the stock he had sold plus much more. He also borrowed a great deal of money for this.
When prices crashed and the stock became worthless, he lost money Newton supposedly said:
I can calculate the motion of heavenly bodies, but not the madness of people
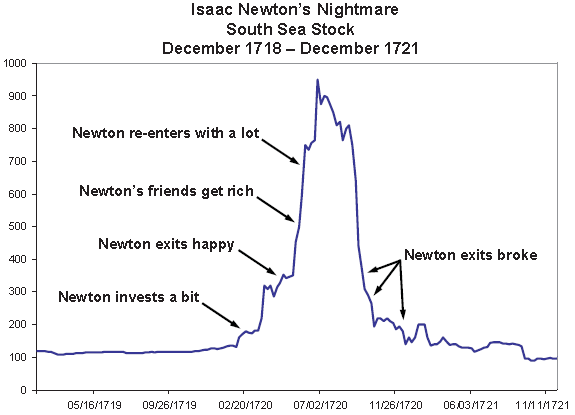
South Sea Bubble,How Newton lost money
Japan Asset Price Bubble 1985-1991
The Japanese asset price bubble was an economic bubble in Japan from 1986 to 1991 in which real estate and stock market prices rose due to excessive monetary easing policy of the Bank of Japan at the time.
In 1985 there was a sharp yen appreciation, and the Bank of Japan lowered short-term interest rates and eased money in response. This was due to a recession in the US in the 1980s which led to Plaza accord beung signed by Japan, the United Kingdom, France, West Germany, and the United States in 1985, to reduce the imbalance in trade between the countries.
The BoJ had slashed the official discount rate from 5.00% (January 30, 1986) to 2.50% (February 23, 1987). The official discount rate remained unchanged until May 30, 1989.
Between January 1985 and December 1989 Nikkei 225 stock price index tripled
An index of land prices in Japan‟s six largest cities almost tripled in real terms between 1985 and 1990.
- The average price per 1 sq. metre for land in Tokyo commercial districts in 1984 was 1,333,000¥ (U$5,600 assuming in 1984 that 1 U$=238¥).
- In just a year, the average price per 1 sq. metre for land in Tokyo commercial districts increased to 1,894,000¥ (U$7,958 assuming in 1985 average 1 U$=238¥). This roughly translates to an increase of 42% over just a year.
- By 1986, the average price per 1 sq. metre for land in Tokyo commercial districts had risen as high as 4,211,000¥ (U$25,065 assuming 1986 average 1 U$=168¥), a jump of 122% compared to 1985. Residential land jumped from an average 297,000¥/U$1,247 per 1 sq. metre (in 1985) to 431,000¥/U$2,565 per 1 sq. metre (in 1986), an increase of 45%.
The Bank of Japan hiked the interest rate on May 31, 1989,
By August 1990, the Nikkei stock index was down to half its peak. By the middle of 1992, the index in real terms was less than 20% above its January 1985 level.
By late 1991, asset prices began to fall. Land prices fell more gradually than did stock prices, but by 1998 the real land price was no more than 20% higher than its 1985 value.
Though the price bubble burst in 1992 but Japan’s economy stagnated and the decline continued for more than a decade. From 1991 to 2003, the Japanese economy, as measured by GDP, grew only 1.14% annually, well below that of other industrialized nations This decline resulted in a huge accumulation of non-performing assets loans (NPL), causing difficulties for many financial institutions. The bursting of the Japanese asset price bubble contributed to what many call the Lost Decade.
When the bubble party ended, its hosts appeared to have no idea how to clean up the mess left by absurdly high share and property prices.
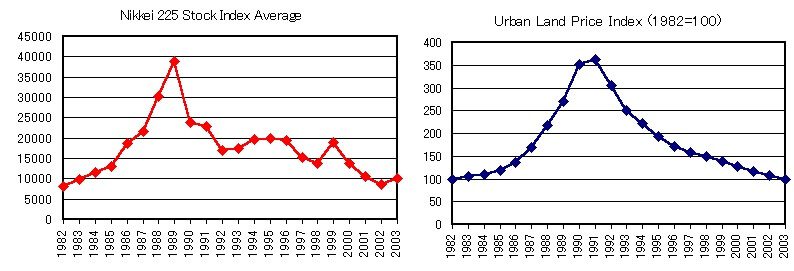
Japan real estate and stock price bubble
Dot Com Bubble in US in 2000
The dot-com bubble (also known as the dot-com boom, the tech bubble, and the Internet bubble) was the US stock market bubble caused by excessive speculation in Internet-related companies in the late 1990s, a period of massive growth in the use and adoption of the Internet.
Between 1995 and its peak in March 2000, the Nasdaq Composite stock market index rose 400%, only to fall 78% from its peak by October 2002.
The 1993 release of Mosaic and subsequent web browsers gave computer users access to the World Wide Web, greatly popularizing the use of the Internet. This marked the shift to the Information Age, an economy based on information technology, and many new companies were founded.
The Taxpayer Relief Act of 1997, lowered the top marginal capital gains tax in the United States & a decline in interest rates increased the availability of capital.
As a result of these factors, many investors were eager to invest, at any valuation, in any dot-com company, especially if it had one of the Internet-related prefixes or a “.com” suffix in its name. Venture capital was easy to raise. Investment banks, which profited significantly from initial public offerings (IPO), fueled speculation and encouraged investment in technology
Y2K problem: Around the turn of the millennium, spending on technology was volatile as companies prepared for the Year 2000 problem. There were concerns that computer systems would have trouble changing their clock and calendar systems from 1999 to 2000 which might trigger wider social or economic problems.
But due to large-scale efforts to correct the bug before the year 2000, there was virtually no impact or disruption.
Most dot-com companies incurred net operating losses as they spent heavily on advertising and promotions to harness network effects to build market share or mind share as fast as possible, using the mottos “get big fast” and “get large or get lost”. These companies offered their services or products for free or at a discount with the expectation that they could build enough brand awareness to charge profitable rates for their services in the future.
The causes for its downfall are numerous, but evidence of this decline first appeared within the big telecom hardware providers, who at the time were supplying most of the tech startups and dotcoms with servers and networking hardware. Once revenue at the telecoms reduced dramatically, it rippled through their respective end markets and, eventually, the entire economy slipped into recession in 2001.
- Globe.com raised $28 million in its IPO and had a market cap of $842 million
- Globe.com opened at $87 per share in first-day trading in 1998, although the original asking price was only $9 per share.
- Two years after its lights-out IPO, Globe.com was trading under $1 per share and was soon delisted by Nasdaq
During the crash, many online shopping companies, such as Pets.com, Webvan, and Boo.com, as well as several communication companies, such as Worldcom, NorthPoint Communications, and Global Crossing, failed and shut down.
Some companies, such as Cisco, whose stock declined by 86% and Qualcomm, lost a large portion of their market capitalization but survived.
Others such as eBay and Amazon.com, also lost value but recovered quickly.
The most successful entrepreneurs, such as Mark Cuban, sold their shares or entered into hedges to protect their gains.
Subprime mortgage crisis 2008
The United States subprime mortgage crisis occurred in the US between 2007 and 2010 and contributed to the U.S. financial crisis. It was triggered by a large decline in home prices after the collapse of a housing bubble, leading to mortgage delinquencies, foreclosures, and the devaluation of housing-related securities. The ensuing 2007 banking crisis and the 2008 financial crisis produced the worst recession since the Great Depression of 1929.
In the early-to-mid 2000s, interest rates on house payments were actually quite low. The prime rate for a mortgage is what is offered to people with good credit and a history of dependability, Subprime is for those who struggled to meet those standards.
A mortgage-backed security (MBS) is a type of investment which is secured by a mortgage or collection of mortgages. The mortgages are collected together and sold to a group of individuals (a government agency or investment bank) that packages, the loans together into a security that investors can buy. These are also called as derivatives.
US Banks sold too many mortgages to feed the demand for mortgage-backed securities in the secondary market.
The first warning of the danger of mortgage-backed securities and other derivatives came on February 21, 2003, when Warren Buffett wrote to his shareholders, “In our view, however, derivatives are financial weapons of mass destruction, carrying dangers that, while now latent, are potentially lethal”
People who couldn’t afford homes or get approved for loans were suddenly qualifying for subprime loans and choosing to buy, and American homeownership rose exponentially.
By 2005, some began to fear that this was a housing bubble. From 2004-2006, the Federal Reserve raised the interest rate over a dozen times in an attempt to slow this down and avoid serious inflation. By the end of 2004, the interest rate was 2.25%; by mid-2006 it was 5.25%.
When the Fed began raising interest rates over and over, those loans became more expensive and the borrowers found themselves unable to pay it off.
Home prices fell tremendously as the housing bubble burst. This crushed many recent homeowners, who were seeing interest rates on their mortgage rise rapidly as the value of the home deteriorated.
When home prices fell in 2006, it triggered defaults. The banks foreclosed on the houses but value of these houses were down. That meant banks were also taking massive losses on real estate. The risk spread into mutual funds, pension funds, and corporations who owned these derivatives. Investors got hit hard as well, as the value of the mortgage-backed securities they were investing in tumbled.
The U.S. financial sector came to collapsing during the stock market crash of 2008 and 2009. Soon, the U.S. Congress approved a massive government funding project that, while stabilizing the markets, also bailed out “too big to fail” banks. Additionally, the Federal Reserve bought up languishing mortgage securities and steered interest rates toward zero percent. The strategy largely worked, as the stock market, after two years of jitters, began climbing again in late 2009 — and the economy began to recover, albeit at a glacial pace.
Lehman Brothers
Lehman Brothers were one of the largest investment banks in the world for years. It was also one of the first investment banks to get very involved with investing in mortgages, something that would pay off until it became their downfall.
The plummeting price of real estate and the widespread defaulting on mortgages crushed Lehman Brothers. They were forced to close their subprime lenders, and despite their many attempts to stop the bleeding (such as issuing stock) they continued to take on losses until, on Sept. 15, 2008, Lehman Brothers applied for bankruptcy. Only 18 months earlier, the company’s stock price was trading at $86 per share, and the company had reported net income of $4.2 billion in 2007.
Lehman Brothers was one of the most prominent financial-service firms in the world. Its rapid descent into bankruptcy was a major cause of the 2008 stock market crash.
Can we predict the Bubble?
The well-known dealer Jim Roger has said that, “Costs can go past what you can envision!”. It is in every case extremely testing and an almost incomprehensible undertaking for analysts to anticipate the exact time when the air pocket will blast and the lunacy will end.
Jack D. Schwager in his book Market Wizards says that “We can foresee bearing yet not the size in the market“.
Jesse Livermore, a well known American financial specialist, and a security expert announces, “Hypothesis is ancient. Whatever occurs in the securities exchange today has occurred previously and will happen once more. I have always remembered that“.
Related Articles:
We read about the South Sea Bubble today and wonder how so many people got involved in such a dubious undertaking.
It may seem foolish to pay $1m for a tulip bulb – but if you hope to sell it on to another receptive buyer for $2m, then won’t it be a rational investment. This is known as the “greater fool” theory.
But it must be said if something similar was to be launched today, who would not be tempted at the thought of a great deal of easy money!!