Whenever you buy or invest in a small object of daily use, you see through the same and then make a decision as to how you are going to reap benefits out of it in the near future. Similar approach is deemed essential when you are investing in companies. After all, it is your hard-earned money. And, here, you are dealing with more complicated investment preposition.
Financial information analysis is an important aspect while taking an investment decision. Every individual investor strives for a profitable portfolio. Thus, it is important to understand the ratios that give the meaning to the financials and help you in taking an analytical approach to decide.
Table of Contents
Fundamental Analysis and Ratios
Fundamental analysis is when an investor analyses a company’s future profitability based on its business environment and financial performance i.e you assess the general efficiency of a company’s operations, its future growth and profit-making potential. Both qualitative and quantitative aspects of the company are considered. On the basis of these aspects, one decides whether or not to invest in the shares of the company.
Fundamental analysis is distinct from the other branch of equity analysis called technical analysis. In Technical Analysis, Investment decisions are taken based on patterns of the company’s historical share price, not much attention is paid to the financial performance of the company.
- Financial Ratios is a quick way to identify the health of the company.
- It is important to know Liquidity, Profitability and Valuation Ratios before starting with the investments.
- Good knowledge of Financial Ratios will help to choose right shares for investing and help build Wealth.
Price Earnings (P/E) ratio
P/E ratio is the ratio which gives the measure of a company’s earnings relative to its current share price.
- What you need: Income Statement, Most Recent Stock Price
- The formula: P/E Ratio = Price per Share / Earnings Per Share
For example, if the current share price of a company is 50 and its earnings per share during the last 12 months were 2. In this case, the P/E ratio is 50/2, which is 25.
This ratio can be compared to the P/E of the industry and P/E of the company during last year. If the P/E of the company is greater than the industry P/E, it is a good buy, even though it is less in comparison to its historical value. The ratio is an indicator of a stable company and the futuristic growth. However, it is vital to understand the overvalued P/E, which could be because of the increased debt or future earnings, which is very subjective.
This YouTube Video explains the PE ratio in detail
Debt to Equity (D/E) ratio
D/E ratio indicates the promoter’s capital or equity in the company. Generally, lower value is considered to be better. However, it is also an indication of the expansion through fund raising.
- What you need: Income Statement
- The formula: Interest Coverage Ratio = EBIT / Interest Expense
An added perspective to the higher ratio is the case where cost of capital raised is lesser than the returns the company is reaping. In this case, the investment by an investor is justifiable as the company is on the track of expansion and is utilizing the raised capital for profit making.
Price to Book Value (P/BV) ratio
The ratio indicates the intrinsic value of company’s assets. It is a comparative of the company’s market price to its book value. Book value gives the picture of the tangible assets which would be used to pay the liabilities incase of insolvency.
- What you need: Balance Sheet, Most Recent Stock Price
- The formula: P/B Ratio = Price per Share / Book Value per Share
Ideal P/BV ratio should be less than one, as it indicates that the book value is more than the market price. This in turn, impersonates that the company is covered through the liquid assets in case of any insurgent situation.
Operating Profit Margin (OPM)
Dividing operating margin by net sales gives the figure which indicates the operation efficiency of an organization. If OPM is rising over a period of time, it is a good indicator. It shows that the company is efficiently converting its raw material in finished goods.
Return on Equity (ROE)
A company invests to earn returns. The ratio of net income to shareholders’ equity is an indicator of profitability. It indicates that the investments are reaping returns. An Ideal ROE ranges from 15 to 20.
- What you need: Income Statement, Balance Sheet
- The formula: Return on Equity = Net Income / Average Stockholder Equity
ROE tells you how good a company is at rewarding its shareholders for their investment.
For ex, if Company B reported 10,000 of net income and its shareholders have 200,000 in equity, its ROE is 5%. For every Rs 1 of equity shareholders own, the company generates Rs 0.05 in profits each year. As with ROA, higher is better.
Higher debt also inflates ROE. Therefore, while investing, this aspect should be kept in mind.
Current ratio
Current assets to current liability is an indicator of the liquidity position of the company. It reveals how a company can cover its short terms liability through its short-term assets.
Current ratio is an indicator of working capital. It reflects how a company is fulfilling the day-to-day operational requirements. An Ideal ratio is 2:1.
Current assets are the assets that can be converted into cash within a time period of one year. Current liabilities are the obligations which may arise within a time period of one year.
- What you need: Balance Sheet
- The formula: Current Ratio = Current Assets / Current Liabilities
Interest Coverage ratio
This ratio is EBIT (Earnings before Interest and Tax) divided by Interest Payable. It is an indicator of how a company is servicing its interest payable from its operating income. It is an indicator of solvency.
- What you need: Income Statement
- The formula: Interest Coverage Ratio = EBIT / Interest Expense
Asset Turnover ratio
This is the ratio which indicates how the company is utilizing its assets to generate profits. It is an important indicator as it validates the effective utilization of assets. It also reflects effective management. A higher asset turnover ratio is always better.
- What you need: Income Statement, Balance Sheet
- The formula: Asset Turnover Ratio = Sales / Average Total Assets
The asset turnover ratio tells you how good the company is at using its assets to make products to sell. For example, if Company A reported Rs 100,000 of sales and owns Rs 50,000 in assets, its asset turnover ratio is 2x. For ever Rs 1 of assets it owns, it can generate Rs 2 in sales each year.
Dividend Yield
Dividend per share divided by the company’s share price is called the dividend yield. It is a reflection of the return that the company is paying (payout). The higher value indicates that the company is doing well but a lower value may not indicate the reverse as the company may re-invest the profits for future growth.
- What you need: Income Statement, Most Recent Stock Price
- The formula: Dividend Yield = Dividend per Share / Price per Share
A company’s performance is based on both macro and micro economic factors. Hence before adding the company’s stock to your demat account, it is essential that the financial interpretations are not considered in unison are being used along with macro-economic factors to make an informed investment decision.
Image below from Pinterest shows various statements
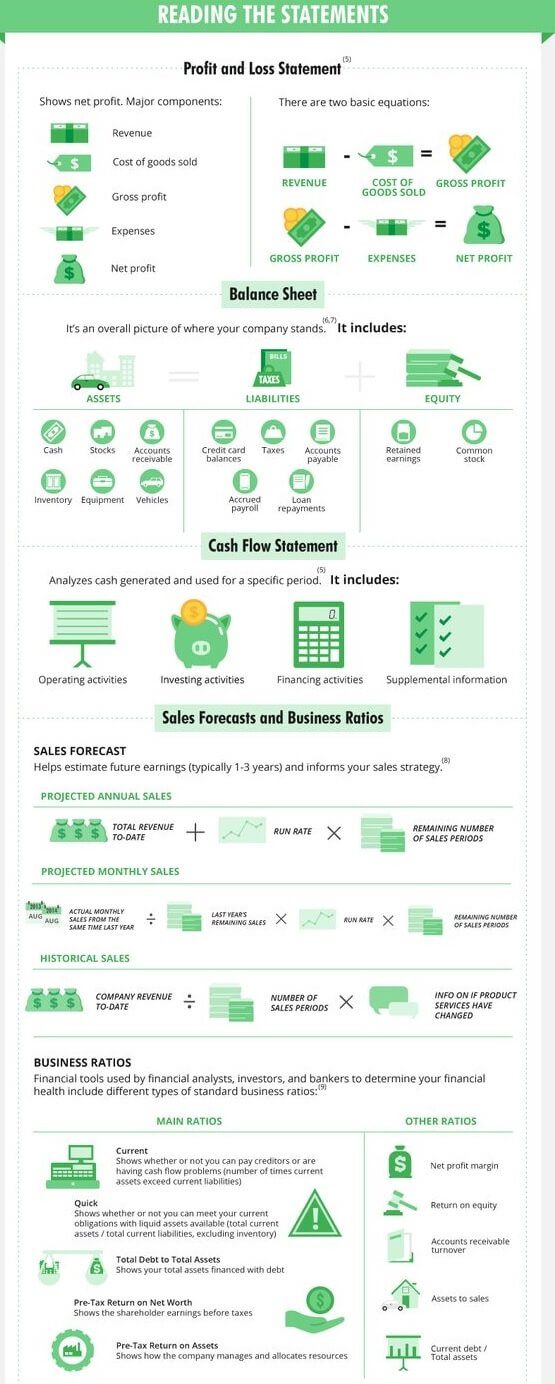
Financial statements used in Fundamental Analysis
Related Articles:
All About Stocks, Equities, Stock Market, Investing in Stock Market
- Stock Market Index: The Basics
- Stock exchange: What is it, Who owns, controls
- Returns of Stock Market, Gold, Real Estate,Fixed Deposit
- Investing in Equities: Stocks vs Mutual Funds
- How to start investing in Stock Market?Transaction costs while buying or selling shares or stocks