The stock market is volatile, we all know. And investors also want to predict the way the market would perform in the coming days. VIX indicates the volatility of stocks indices. VIX is designed to indicate investors’ perception of the annual market volatility over the next 30 days, higher the VIX, higher the expected volatility and vice-versa. With VIX, one can try to predict the way the market would perform in the coming time period. VIX is highly tracked in media as shown in the image below. Let’s try to understand what is VIX? how one can use VIX to predict the fall or rise in the market.
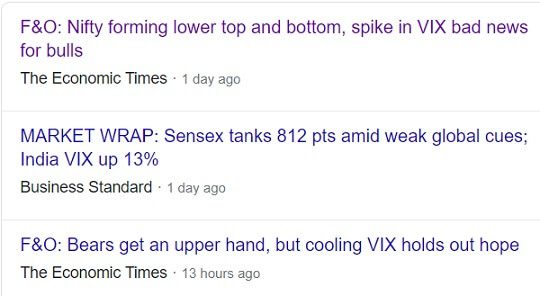
VIX in news
Table of Contents
Overview of VIX
Investors, research analysts and portfolio managers look to VIX values as a way to measure market risk, fear before they take investment decisions.
- VIX stands for Volatility Index. VIX is also known as the Fear Gauge or Fear Index.
- When one says VIX, it means for the US stock market and shows the volatility of the S&P 500 index based on S&P Options.
- For India Volatility Index based on the NIFTY Index Option prices is called as India VIX.
- Volatility Index is for an index and not stock. In India, two popular Indices are Sensex & Nifty. VIX is available for Nifty 50 only.
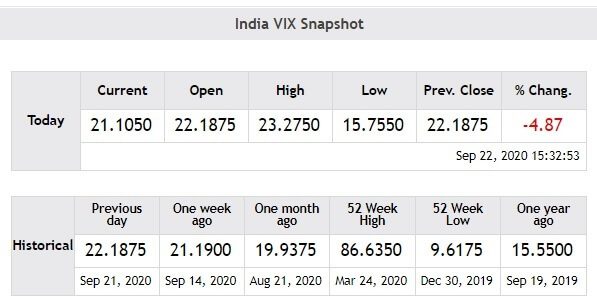
- VIX is a number. For example, the closing value of India VIX on 1st Sep 2020 was 21.8
- India VIX value is available at NSE website. Historical data on NSE website for VIX is at https://www1.nseindia.com/products/content/equities/indices/historical_vix.htm
- VIX is dynamic. VIX changes during the day just like a stock price. On 1 Sep 2020,VIX opened at 22.8350, High was 23.2425, Low was 21.110 and ended at 21.8
- Though VIX is a number it is interpreted as a percentage. So if today India VIX is 20 then one can expect the Nifty to be between +20% and -20 % from today’s price of Nifty for the next 1 year for the next 30 trading days at a 68% confidence level (one standard deviation of the normal probability curve).
- India VIX is derived from index option prices, using the best bid and asks quotes of the out-of-the-money near and mid-month NIFTY option contracts traded on the Derivatives segment of NSE.
- By observing what the options investors are buying and selling one may get clues of investor sentiments.
- VIX ranges between 15-35. In last 1 year India VIX has moved between 9.61(27 Dec 2019) to 86.63(on 24 Mar 2020)
- VIX reflects fear and the market always co-varies negatively with fear. That is the crux of the link between VIX and the Nifty index.
- If VIX is high, one can expect higher volatility means there would be big stock market movement
- When VIX falls it means that there is lower uncertainty and market confidence is high and the direction of the trend is clear.
- When VIX rises it shows there is a lot of uncertainty in the markets and market would be volatile in the coming days.
- VIX is generally used by people who trade Nifty options, especially the option writers. For example, shorting options above or below the expected monthly range of the Nifty.
- Tracking VIX helps in finding the bottom of the stock market.
- While rising VIX is indicative of an expected rise in volatility but during budgets, elections and/or during market corrections it is not necessarily deterministic.
India VIX
What is VIX?
Basics of VIX
Volatility is described as the rate and magnitude of changes in prices and changes with change in price
Investors, research analysts and portfolio managers look to VIX values as a way to measure market risk, fear before they take investment decisions. VIX is also known as the Fear Gauge or Fear Index.
When one says VIX, it means for the US stock market and shows the volatility of the S&P 500 index.
For India Volatility Index based on the NIFTY Index Option prices is called as India VIX.
VIX is designed to indicate investors’ perception of the annual market volatility over the next 30 days, higher the VIX, higher the expected volatility and vice-versa.
Volatility Index or VIX is a measure, of the amount by which an Index is expected to move based on the order book of the underlying index options. VIX is calculated as annualised volatility, denoted by a number and used as a percentage e.g. 20%.
For example, if today India VIX is 20%, This means we expect annual change of 20% in the Nifty over the next 30 days. That is, one can expect the Nifty to be between +20% and -20 % from today’s price of Nifty for the next 1 year for the next 30 days. So if Nifty today is at 10,000 the expected range of Nifty is between 8000 and 12,000 for 1 year.
If you want to know how much volatile Nifty would be in a time period(T) say a month using VIX, then the formula is (VIX/Sqrt (T)) % where T would be 12, square root of 12 as there are 12 months in a year
For example, you want to know how much volatile Nifty be in the coming month so if VIX is 20, Square Root of 12 is 3.464, the the expected volatility of Nifty as per VIX for the next 1 month = 20/3.464 = 5.77%
History of VIX, India VIX
VIX was the first benchmark index introduced by the CBOE(Chicago Board Options Exchange) in 1993 to measure the market’s expectation of future volatility. It represents the market’s expectation of 30-day future volatility of the S&P 500 index. It is constructed using the implied volatilities on S&P 500 index options (SPX) explained in Technical definition of VIX.
NSE started the India VIX in 2008, India VIX uses the computation methodology of CBOE, with modifications to adapt to the NIFTY options order book ex using cubic splines, etc. From the best bid-ask prices of NIFTY Options contracts, a volatility figure is calculated which indicates the expected market volatility over the next 30 calendar days.
India VIX is an index and to trade an index you need derivative (F&O) contracts on it. So India VIX futures are available which are used by sophisticated traders to use the India VIX to hedge the volatility risk and/or to speculate.
Historical data for India VIX is available from Mar 02, 2009, even though the futures trading started only on Feb 26, 2014
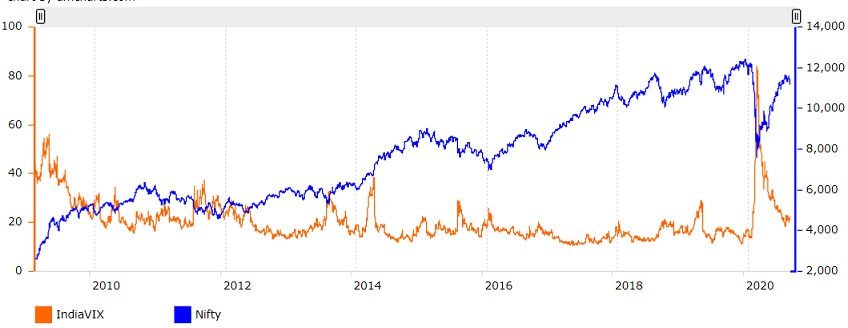
Range of India VIX is usually between 13 to 25 as shown in the image below
VIX had spiked to high levels of Sep 2011 due to twin tower attack in US(9/11), in Apr 2014 due to elections and 86.63 on 24 Mar 2020 due to Coronavirus pandemic.
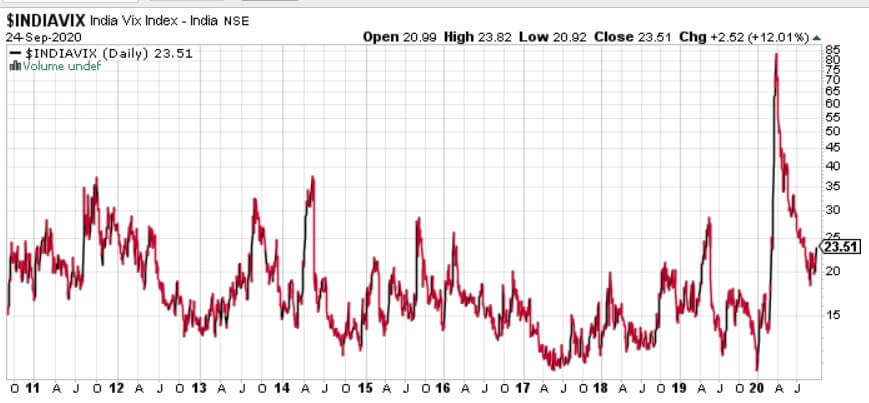
India Vix Chart
Technical definition of VIX
The volatility index is derived from the index option prices, using the best bid and asks quotes of the out-of-the-money near and mid-month NIFTY option contracts traded on the Derivatives segment of NSE. So by observing what the options investors are buying and selling one may get clues of investor sentiments.
The concept of computing implied volatility or an implied volatility index dates back to the publication of the Black and Scholes 1973 paper, The Pricing of Options and Corporate Liabilities, published in the Journal of Political Economy, which introduced the seminal Black–Scholes model for valuing options.
Menachem Brenner and Dan Galai published research papers in 1989. In 1992, the CBOE hired consultant Bob Whaley to calculate values for stock market volatility based on this theoretical work.
The VIX calculation is based on the Black Scholes Model which is used to price options contracts. The Black Scholes model uses five key variables to arrive at the ‘fair price’ of an options contract: the strike price of the contract, the market price of the stock, the time to expiry, the risk-free rate and volatility.
The calculation formula of VIX from the paper at NSE website is shown below. But VIX is easier to use it than to understand the formula.
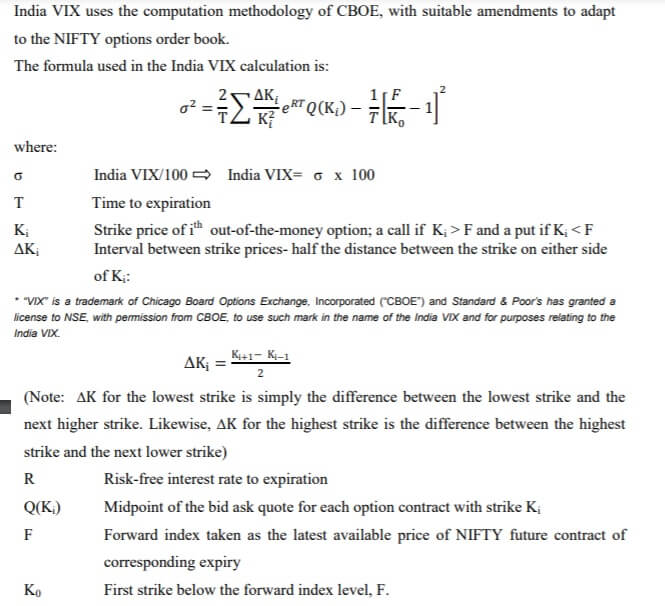
India VIX formula
Correlation of India VIX & Nifty
India VIX represents the fear or risk factor in the stock market. Therefore, an increase in India VIX means risk is increased therefore the market should fall. So Typically, there is an inverse correlation between India VIX and Nifty.
Rational being If the market is expected to fall, many option writers will buy put options. The premium for these put option will increase, hence VIX will increase.
So one would find VIX at its low level when the index is at its high point, and the VIX at high levels when the market is trying to find a bottom.
But there have been times when Nifty and VIX rose together and the correlation between the two has almost turned positive. It happened in 2014 when there were General elections in India. Becuase if the market rises, the bulls will buy call options, the premium will again become volatile, hence VIX will rise. As the bears are scared, VIX again shows fear or for bulls greed.
If the India VIX is decreasing then it means that the market should go up due to low risk and fear.
If VIX is high then the market would fall and if the VIX falls then the market would rise.
India VIX & Nifty movement
Finding out the India VIX, Historical data
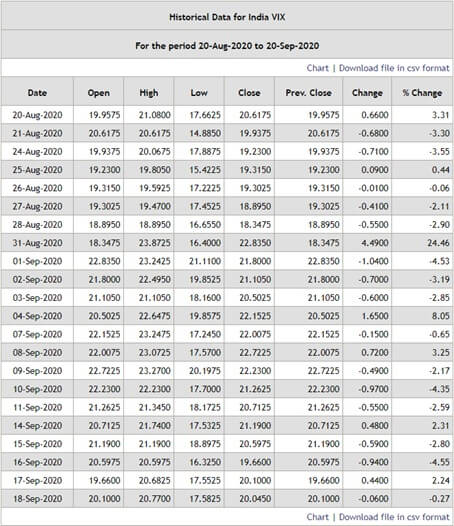
To find out the VIX , go to the NSE website. Under Main Menu click on Products -> Equities -> Indices -> Historical India VIX Data. Alternatively, you can visit the link given below to check the Historical Data – India VIX.
https://www1.nseindia.com/products/content/equities/indices/historical_vix.htm
Once you click the given link, a page similar to the image given below would appear.
Select the period in which you would like to calculate the VIX. For example, say 20 August 2020 – 20 September 2020. Click the Get Data button and a table would open.
The data reflects the open, high, low, close, prev. close, change, and % change respective to the dates. Here, it could also be found that between the period of 20 August 2020 to 20 September 2020 there were 22 trading sessions. During the given period, the VIX recorded a high of 23.8725 and a low of 18.895 having an average of 21.41 for the past one month.
Here, it must be noted that the VIX is dynamic. The VIX that is there today may not be the same tomorrow. It may either jump or fall.
How to get India VIX data from NSE
Market Prediction with India VIX
If you want to calculate expected volatility for the near term using the VIX, say a month then the formula to use is (VIX/Sqrt (T)) %
- If you want to know what is the expected monthly volatility of Nifty based on VIX of 16.8025, you should divide 16.8025 by square root of 12 (T = 12, 12 30 day terms in 1 year). So the expected volatility of Nifty using VIX for the next 1 month = 16.8025/3.464 = 4.85%
- This information of an expected monthly range of Nifty can be used by people who trade Nifty options as well, especially the option writers. For example, shorting options above or below the expected monthly range of the Nifty.
Let’s predict the market with India VIX in the period 20 September 2020 to 20 October 2020.
To predict the market with Indi VIX, we have to first calculate the average VIX of the last month. In our case, from 20 August 2020 to 20 September 2020, the average VIX was 21.41. This 21.41% movement can be shown by the market in the next 1 year. The market can either go 21.41% up from here or 21.41% down from here in the coming 1 year.
Now, for finding out the VIX for the next 30 trading sessions, we have to divide the current VIX i.e. 21.41 by the square root of 12 as there are 12 months. This comes out to be 6.18% in 30 sessions. This means that 6.18% of volatility can be expected in the next 30 sessions.
Note that in a month there are around 17 trading sessions, therefore, 30 trading sessions would be there in around 2 months.
Thus, we can calculate the moment in 1 month as 6.18/2% = 3.09%
Thus, the average volatility the market can show in the next 1 month is around 3.09%. The market can either be 3.09% up or it can be 3.09% down given the kind of volatility in the VIX as of now.
But if there are any changes in the fundamental factors like breaking news, etc. then the market can show much more movement than the calculated change.
Options Trading with VIX
While trading option with VIX, remember that VIX shows increasing panic.
Higher the panic the more would be the premium which in turn means the rising profits for put writers
But that the profits also depend on the VIX. So if the market is rising and VIX is falling then options will not give you the expected profit in proportion
VIX tells you a lot about what’s happening right now and predicts the future. But one also has past data of India VIX. You can form numerous trading strategies based on the India VIX. It also lets you look at the past. You can compare the current value to the 52 weeks high and low of the values and then make your trading decision. If it is closer to the lower band then you can expect a huge rally coming up in Nifty soon and similarly, you can exit your positions if the value is touching the upper band.
Sentiment plays a big role in decision making for the stock markets, and to that extent, it could be a good idea to glance at the VIX. However, the index is far from perfect, and investors should consider how much weight they want to peg on it.


Trackbacks/Pingbacks