FinKrypt decodes complex finance via stories, articles & infographics simplifying Finance for everyone. They have a reliable audience of more than 30,000 on their social media channel. We had an opportunity to interact with these talented people. The interview with FinKrypt is published below, where their Infographics and Journey. Do check out their website, finkrypt.in, for their interesting collection of graphics, a few of them are given below like India vs China and the World, products offered by Zerodha beyond Kite and Coin, Journey of Nifty
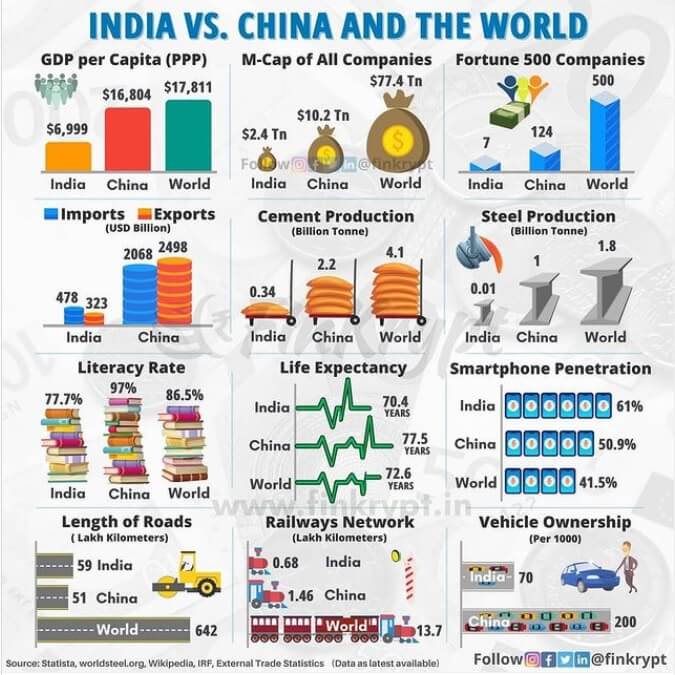
Table of Contents
Why did you start FinKrypt?
We aim to make finance more catchy and easier among the masses in the country. Even for individuals with a non-finance background, it is equally important to understand the basics of finance and manage their money in an effective manner. Many find finance boring and we are trying to get interest of people by making infographics which would attract people towards finance.
Why Infographics?
Infographics are something which are visually appealing. If we can present the complex financial data in a single image, that creates a wholesome view in the mind of the audience. One can understand the entire business model of a company or even the global data, by having a quick glance at the image in less than 10 seconds. If that interests the individual we have a detailed article about the same written on our website.
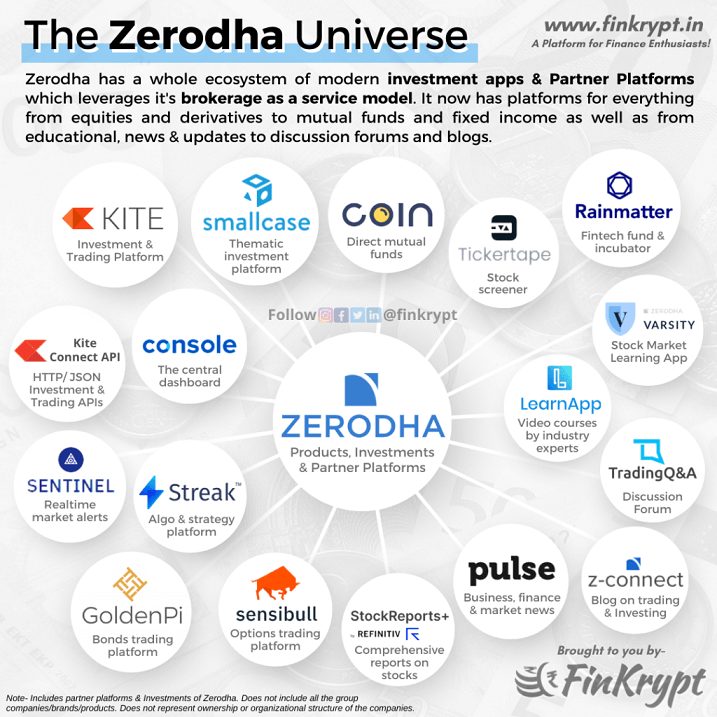
The infographic on what products are offered by Zerodha. They offer more than a platform to buy stocks(Kite) and Mutual Funds.
How do you decide on the subject of the infographic?
We adapt to different situations. Sometimes we have a set series of infographics which we have planned well in advance. Sometimes, you just need to get creative around some recent developments in the field and make sure that you portray that in an engaging way to the audience.
What is the process of making an infographic?
This is something which really can’t be defined. Collection of the data and creating visually appealing graphics are the two important aspects. Sometimes we have the idea, we try and create a graphic around that and sometimes we have a graphic idea so we try and fit in some useful information that Works both ways.
How much time does it take to make the Infographic?
When you are in the flow, the task gets really simple for the collection of the data. Sometimes that takes a lot of time because finding out authentic data sources is not easy. Designing is something which takes time. Again, if you are in the correct mindset, it becomes easy for you.
Which Infographic was most challenging to make?
From the design perspective, the infographics which we made at the start were really challenging. We did not know what will work and what will not. Now, having made 100+ infographics, we have got a fair idea of how to use the time and resources effectively. To be specific
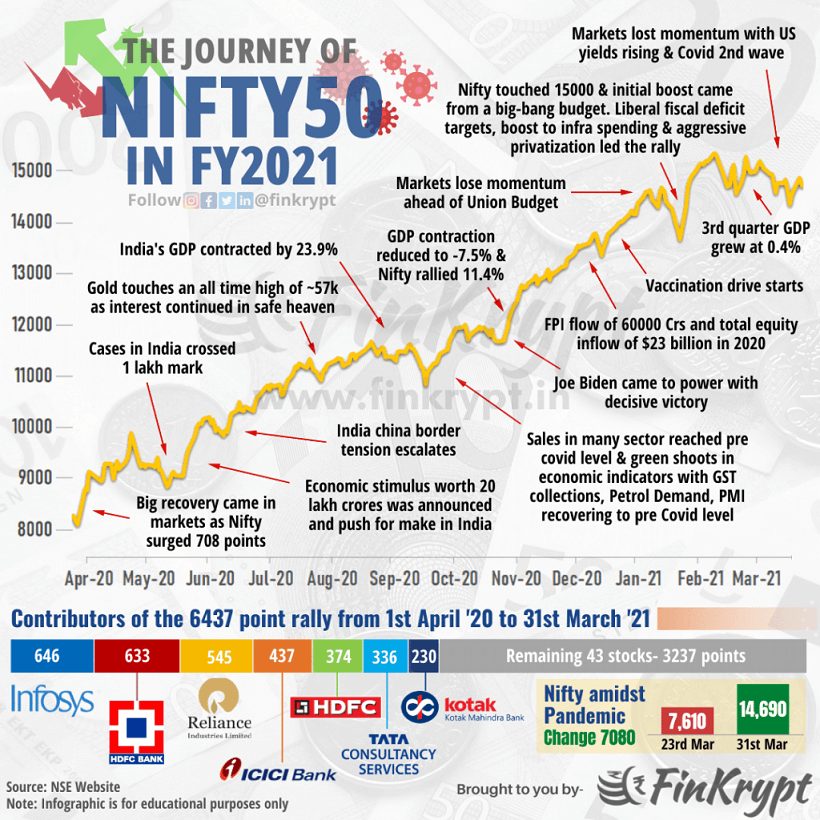
The charts which portray “The journey of sensex” This is something which everyone knows, the challenge was to portray it in a way where people can relate to it.
What have been your learnings since you started FinKrypt?
Adaptability – Understanding the market dynamics. You really need to change your plans and ideas and see what is going around in the world and plan accordingly. What worked for us in the start does not work for us now. We had made great plans at the start, but we have really forgotten them because that was not what the audience enjoyed. We changed our plans and tried to feed the audience to their liking. It did take a great time to build the kind of audience that we have right now.
Consistency – In the beginning, we used to make infographics whenever we had some idea. We were not very consistent with our releases. Sometimes it used to be 7 Infographics a week and sometimes it
was just 3. With time we learned that we got consistent, the increase in the audience was exponential.
What kind of infographics people like and which don’t?
People like something they can relate to. For eg- The journey of the senses, nifty, gold, etc. The information about the FMCG companies and their products Interesting business stories across the world which inspire people.
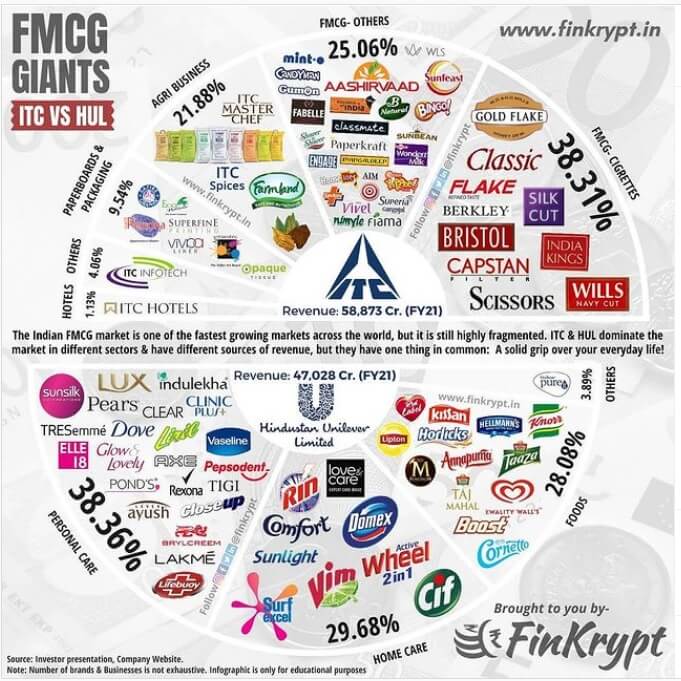
The breakup of the consolidated revenue
What are the plans for FinKrypt?
We have come a long way in building a reliable audience of 30k+ (cumulative) on our social media. We are looking to work more on YouTube as well in coming days. We are also looking forward to
work with other people as well who happen to be in same line as us. In long term, we would want to reach as many as possible via our channels and provide them with Insightful content with
consistency.
Who are the people behind FinKrypt?
Three like-minded and passionate engineers with MBA in Finance.
What do you think is important to know about Finance for your generation?
Finance is something which you come across in your daily life. Understanding the basic concepts is really important for an individual with any educational of professional background. One must understand the dynamics of making money are changing and managing wealth is equally important.
What does an MBA teach you?
MBA helps you prepare in brief about different aspects of finance. The biggest advantage you get here is networking with people from different parts of the country with various educational and professional experiences. You get Engineers, Doctors, commerce graduations, businessmen, etc and each and everyone has a different perspective on things. One must try to gain knowledge and experience from different people and understand how the practical world works
Rapid Fire
Whose Infographic channel you like(other than yours) – Visual Capitalist
Should one do MBA or not?– Depends. For us, doing MBA worked out pretty well.
Favorite Investing Books- Psychology of Money, Rich Dad Poor Dad, The Intelligent Investor, Stocks to Riches, Think & Grow Rich, The Unusual Billionaires
Favorite YouTube Channels – TVF (The Viral Fever), Dice Media, SOIC, Investyadnya
Favorite Instagram channel – Finshots & Finkrypt (Have a look at our homepage & guides section you’ll definitely give us a spot in your fav insta pages list too!)
Favorite Investor – Charlie Munger, Raamdeo Agarwal
Favorite Investor in India– Raamdeo Agarwal, Saurabh Mukherjea
Related Articles:
- An Interview: 20s and Money
- Meet Personal Finance Blogger : Pattu of FreeFinCal
- Meet Personal Finance Blogger : Manshu of Onemint
- Managing finances of Single, New in Job and Loans
We wish these young guys best of Luck. If you want to understand the business of Finances in infographics you must follow FinKrypt. Do you think that infographics are useful? Which kind of Infographics do you want to see more of?
