To find What is the right price to enter and leave the stock market to make a handsome profit one needs to do stock analysis. There are two ways to do the stock analysis, Fundamental and Technical Analysis like two sides of the coin. Technical Analysis is predicting price movement of stocks based on an examination of past price movements. This article talks about basics of stock Analysis?What is Technical Analysis? How is Technical Analysis different from Fundamental analysis?
Table of Contents
Stock Analysis
The Indian stock market is open from 9:15 AM to 15:30 PM. During the session of 6 hour 15 minute millions of trades take place. For an individual minute buying or selling happens i.e a trade is getting executed on the exchange at different prices. Question is Why are people buying the stock at that price? Why are the people selling the stock at that price?
Stock analysis is a technique to measure the pulse of the stock and determine the right price to enter and exit stock with good profit. There are two major approaches to do the stock analysis the Technical Analysis and Fundamental Analysis. Both these analysis uses very different ways to analyze stocks and have been quite effective in producing good results.
Technical Analysis
Let’s say you want to go to a restaurant to eat food. How would you choose a restaurant? Often we look at the review ratings on the sites like zomato, food panda and shortlist the ones which serve the kind of food you want with high ratings. Assumption is that the restaurant is getting good ratings because the food is good i.e your choice is based on the crowd’s preference. However, on the flipside the crowd need not always be right. What are Chances are that you could be eating at a good restaurant?
Technical Analysis is similar to choosing a restaurant as one scans for opportunities based on the current trend or the preference of the market. Technical Analysis is a technique to identify opportunities in market based on the actions of market participants. It believes that the price set by the market reflects the sum knowledge of all participants. So one studies the data generated from the market and from the actions of people in the market. One looks for data such as price levels which are turning points, the volume i.e amounts of stock bought and sold each day and the momentum or rate of change of price over a given period of time. This data is visualized by means of various types of stock charts. One looks to identify patterns in these charts and what message the pattern conveys. By examining the changing price using charts and techniques, technical analysis focuses on What is the price? Where has it been? Where is it going? The image below shows the candle stick chart for Maruti Suzuki from Moneycontrol.com.
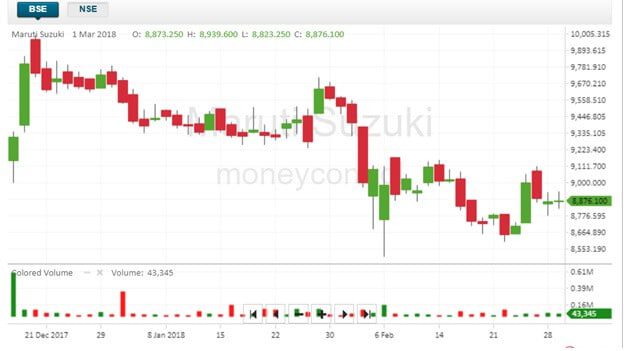
Technical Analysis of stocks
Technical analysis can be applied at any period of time from few minutes to many years.As many use technical analysis for shorter time interval such as days or weeks, technical analysis is popular with traders.
The YouTube video given below explains What is Technical Analysis?
Fundamental Analysis
Definition from Wikipedia “Fundamental analysis of a business involves analyzing its financial statements and health, its management and competitive advantages, and its competitors and markets.”
Fundamental analysis answers the question How much money is the company making and how much is it going to make in the future. Fundamentalists believe that markets are not efficient. They believe that over the long term, the stock prices of a fundamentally strong company tend to appreciate, so will create wealth for its investors.
Fundamental analysis analyses company, industry and economy to come up with a stock’s current fair value and forecast future value. If fair value is not equal to the current stock price, fundamental analysts believe that the stock is either over or undervalued and the market price will ultimately gravitate towards fair value.
Every quarter, companies report earnings. After looking at the balance sheet and other financial details, ratios are used to compare the financials with the price of the stock. The most common ratio used is the Price-to-Earnings or PE ratio. This is computed by dividing the share price with the company’s earnings per share. If the PE is computed using the earnings per share for the year gone by, it is called a trailing PE. Analysts often use the forward PE, where the estimated earnings per share for the current or another year is used.
Analysts follow major companies closely and track if the earnings are matching or better or worse than projected earnings and come up with buy and sell recommendations.
For example Data for Fundamental Analysis of Maruti is shown below
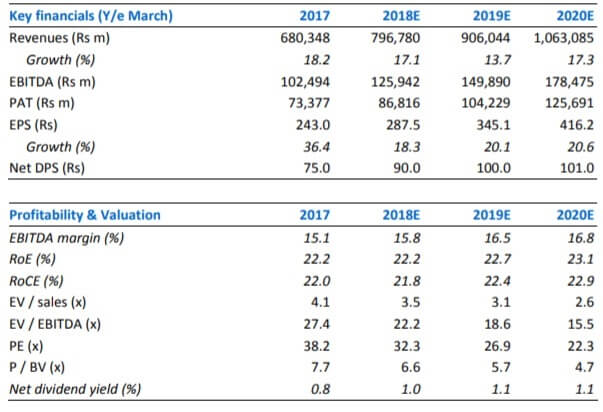
Fundamental Analysis of stocks
If the stock is undervalued this means the stock is selling at a much lower price than what it is actually worth. Suppose a company XYZ is earning Rs 50 per share and Rs 100 is its current share price so its PE ratio is 2. And 5 is the average PE ratio of the industry, then the stock of company is undervalued. If there is another company in the same industry with a PE ratio of 10, then its stock will be considered to be overvalued.
However, an analyst expects the company to earn Rs 100 per share in the next financial year. Then the forward PE would be 1.This shows that the price is even more undervalued when you consider the company’s growth.
YouTube video explaining Fundamental Analysis.
Technical Analysis or Fundamental Analysis
There are really only two honest answers: “Both” or “It depends” just like art or science question, both have a value, a place in stock analysis. Table below compares
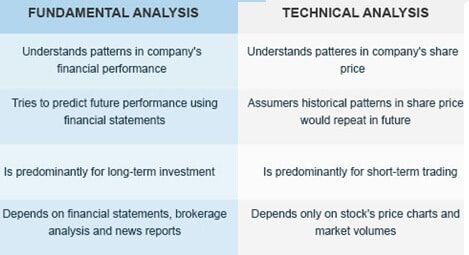
Comparison of Technical Analysis with Fundamental Analysis
When you think about fundamental analysis it seems logical investing where you are looking at the financial soundness of a company and its business prospects. Understanding everything rational about the company will not guarantee success – BECAUSE markets are not simply rational adding machines. Markets are emotional also. But there are limitations of Fundamental Analysis. Fundamental Analysis is time consuming, tedious, is the assumption based with drawbacks of extrapolation and time frame selection and have no reliable trade signals, etc. The disadvantage of fundamental analysis is that it can also get you on board a good stock but at the wrong time and you may need to hold on to the stock for a long time.
“One way to end up with $1 million is to start with $2 million and use technical analysis,” said Ralph Seger. Predicting future price based on past price may seem like reading tea leaves or voodoo for helping you figure out the best investments for your money.Just like weather forecasting, technical analysis does not give absolute predictions similarly, technical analysis can help to anticipate what is “likely” to happen to prices over time
On the other hand Technical analysis by analyzing past market movements of the company’s stock, can tell you a lot about the psychological aspects of the market. You can buy a position in a fundamentally sound company, but if its shares have already run up a lot, you could still find yourself in a losing position on a pullback, something you could have potentially avoided through the use of technical analysis.
Earlier fundamental analysis was the only investment method was given lot of credibility. But now because of high-speed computing, technical analysis has become easier and widely available. Computer modeling is being used by firms to determine the entry and exit points of stocks.
The general notion is that technical analysis is useful from a short-term perspective while fundamental analysis is useful for long-term trades and investments, The best approach to investing should involve some combination of fundamental and technical analysis. One can use fundamental analysis to choose stocks or sectors that have strong fundamentals and use technical analysis for the specific entry and exit points.
How to invest in stock market?
After the stock analysis, the question comes up How to invest in stock market. A person cannot go directly to the stock market to buy or sell shares.
A stock market is where you trade financial instruments like bonds, mutual funds, derivatives as well as shares of companies. A share market only allows trading of shares.
The stock exchange is the platform that provides the facilities used to trade company stocks and other securities. A stock may be bought or sold only if it is listed on an exchange. India’s premier stock exchanges are the BSE (Bombay Stock Exchange) and the NSE(National Stock Exchange)
Buying and selling of stocks have to be done through brokers. They are individuals, agencies or companies authorised by Sebi to trade on the stock exchanges. Brokers charge a fee called as the brokerage for the assistance they provide.
Now shares cannot be held in physical form but in dematerialised form. So You need to open a demat and trading account by providing your PAN and Aadhaar card. This account will hold the stocks that you have purchased and will reflect them in your name. Buying and selling of shares means Informing the broker the quantity to be bought or sold along with the price at which you wish to carry out the transaction
Books for Stock Marketing
Some of the popular books to learn about Stock Marketing are
The Intelligent Investor: known as the Bible of the stock market. A must-read book written by the legendary Benjamin Graham, the mentor of the greatest investor of all time- Warren Buffet. The book explains the fundamentals of the stock market for value investors.
Buy The Intelligent Investor from Amazon.in
Buy One Up On Wall Street: How To Use What You Already Know To Make Money In the Market: Penned by the famous mutual-fund manager, Peter Lynch, this book elaborates the many advantages that an average investor has over professionals and how they can help them reach financial triumph. . Helps build the basic thought structure to approach portfolio construction, things to look for when picking stocks, where to focus your energies and where not to.
Buy One Up On Wall Street: How To Use What You Already Know To Make Money In the Market from Amazon
How to avoid loss and earn consistently in the stock market by Prasenjit Paul : Written in an easy-to-understand and simple language, this book will guide you on how to select fundamentally strong business, when to buy and sell stocks and above all how to minimize or avoid loss in the stock market.
Buy How to avoid loss and earn consistently in the stock market by Prasenjit Paul from Amazon
How to Make Money Trading with Charts Paperback by Ashwani Gujral comprehensive book on chart patterns and chart analysis using real-life examples from the Indian market. It explains every significant tradable pattern, buy and sell signal, and the use of important technical indicators with the help of more than 150 charts of Indian stocks
Buy How to Make Money Trading with Charts Paperback by Ashwani Gujral from Amazon
The Dhandho Investor: The Low-Risk Value Method to High Returns lays out the powerful framework of value investing. The author has developed the theme of Dhando investing with analogies to some successful businesses and similarities in those businesses with investing. This is a do it yourself investment book which will help all equity investors irrespective of their experience. The case studies are from the practical experience of the author. The chapter on kelly formula for capital allocation is a must read.
Buy The Dhandho Investor: The Low-Risk Value Method to High Returns at Amazon
Related Articles:
All About Stocks, Equities,Stock Market, Investing in Stock Market
- Stock exchange: What is it, Who owns, controls
- Returns of Stock Market, Gold, Real Estate,Fixed Deposit
- Investing in Equities: Stocks vs Mutual Funds
- Transaction costs while buying or selling shares or stocks
- Investing in Stock Market: Open Demat account and Trading account
- Why people Lose Money in Stock Market


Fundamental analysis is a method of evaluating a security in an attempt to assess its intrinsic value, by examining related economic, financial, and other qualitative and quantitative factors. Thanks for sharing.
Most leading brokers cannot spare the time and money to research smaller stocks. You are therefore more likely to find a bargain in this relatively under-exploited area of the stock market. A lot of screeners freely available on the web can be used by investors to catch stocks that may deliver excellent performance. Thanks for sharing a great article. Keep posting.
Thanks for giving such detailed information on the difference between a fundamental and technical analysis and ways to select the right one.
Great post on technical and fundamental analysis of stocks. Fundamental analysis and technical analysis, the major schools of thought when it comes to approaching the markets, are at opposite ends of the spectrum. Both methods are used for researching and forecasting future trends in stock prices, and like any investment strategy or philosophy, both have their advocates and adversaries. Thanks for sharing.
On the off chance that you are a High Total assets Financial specialist, you need to pick the property and deal with credit costs, rental salary, legitimate and charge suggestions.
Stock analysis plays a very important role in investment in shares and securities. To minimize the loss and to generate a good amount of profit an investor has to do a proper research for every stock.
So true.